
Page 64 - Geochemical Anomaly and Mineral Prospectivity Mapping in GIS
P. 64
Exploratory Analysis of Geochemical Anomalies 63
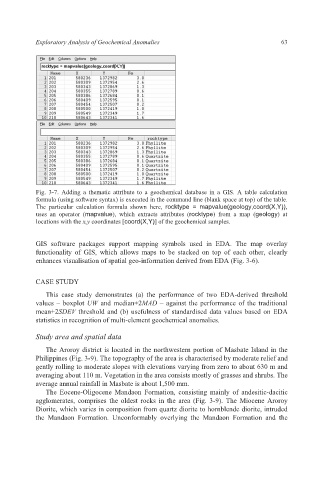
Fig. 3-7. Adding a thematic attribute to a geochemical database in a GIS. A table calculation
formula (using software syntax) is executed in the command line (blank space at top) of the table.
The particular calculation formula shown here, rocktype = mapvalue(geology,coord(X,Y)),
uses an operator (mapvalue), which extracts attributes (rocktype) from a map (geology) at
locations with the x,y coordinates [coord(X,Y)] of the geochemical samples.
GIS software packages support mapping symbols used in EDA. The map overlay
functionality of GIS, which allows maps to be stacked on top of each other, clearly
enhances visualisation of spatial geo-information derived from EDA (Fig. 3-6).
CASE STUDY
This case study demonstrates (a) the performance of two EDA-derived threshold
values – boxplot UW and median+2MAD – against the performance of the traditional
mean+2SDEV threshold and (b) usefulness of standardised data values based on EDA
statistics in recognition of multi-element geochemical anomalies.
Study area and spatial data
The Aroroy district is located in the northwestern portion of Masbate Island in the
Philippines (Fig. 3-9). The topography of the area is characterised by moderate relief and
gently rolling to moderate slopes with elevations varying from zero to about 630 m and
averaging about 110 m. Vegetation in the area consists mostly of grasses and shrubs. The
average annual rainfall in Masbate is about 1,500 mm.
The Eocene-Oligocene Mandaon Formation, consisting mainly of andesitic-dacitic
agglomerates, comprises the oldest rocks in the area (Fig. 3-9). The Miocene Aroroy
Diorite, which varies in composition from quartz diorite to hornblende diorite, intruded
the Mandaon Formation. Unconformably overlying the Mandaon Formation and the