
Page 69 - Geochemical Anomaly and Mineral Prospectivity Mapping in GIS
P. 69
68 Chapter 3
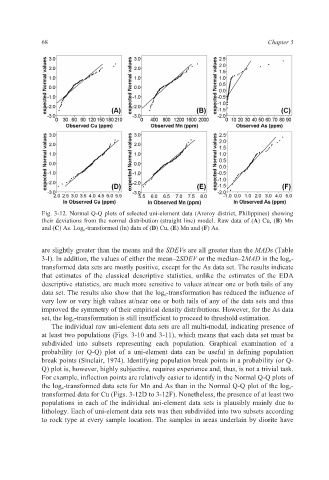
Fig. 3-12. Normal Q-Q plots of selected uni-element data (Aroroy district, Philippines) showing
their deviations from the normal distribution (straight line) model. Raw data of (A) Cu, (B) Mn
and (C) As. Log e -transformed (ln) data of (D) Cu, (E) Mn and (F) As.
are slightly greater than the means and the SDEVs are all greater than the MADs (Table
3-I). In addition, the values of either the mean–2SDEV or the median–2MAD in the log e-
transformed data sets are mostly positive, except for the As data set. The results indicate
that estimates of the classical descriptive statistics, unlike the estimates of the EDA
descriptive statistics, are much more sensitive to values at/near one or both tails of any
data set. The results also show that the log e-transformation has reduced the influence of
very low or very high values at/near one or both tails of any of the data sets and thus
improved the symmetry of their empirical density distributions. However, for the As data
set, the log e-transformation is still insufficient to proceed to threshold estimation.
The individual raw uni-element data sets are all multi-modal, indicating presence of
at least two populations (Figs. 3-10 and 3-11), which means that each data set must be
subdivided into subsets representing each population. Graphical examination of a
probability (or Q-Q) plot of a uni-element data can be useful in defining population
break points (Sinclair, 1974). Identifying population break points in a probability (or Q-
Q) plot is, however, highly subjective, requires experience and, thus, is not a trivial task.
For example, inflection points are relatively easier to identify in the Normal Q-Q plots of
the log e-transformed data sets for Mn and As than in the Normal Q-Q plot of the log e-
transformed data for Cu (Figs. 3-12D to 3-12F). Nonetheless, the presence of at least two
populations in each of the individual uni-element data sets is plausibly mainly due to
lithology. Each of uni-element data sets was then subdivided into two subsets according
to rock type at every sample location. The samples in areas underlain by diorite have