
Page 66 - Geochemical Anomaly and Mineral Prospectivity Mapping in GIS
P. 66
Exploratory Analysis of Geochemical Anomalies 65
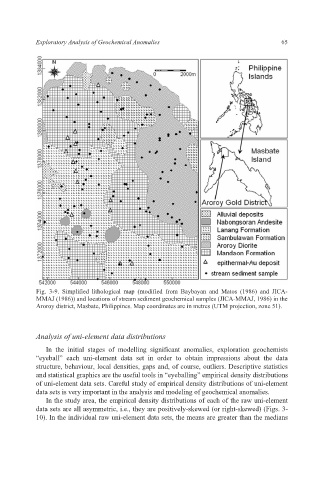
Fig. 3-9. Simplified lithological map (modified from Baybayan and Matos (1986) and JICA-
MMAJ (1986)) and locations of stream sediment geochemical samples (JICA-MMAJ, 1986) in the
Aroroy district, Masbate, Philippines. Map coordinates are in metres (UTM projection, zone 51).
Analysis of uni-element data distributions
In the initial stages of modelling significant anomalies, exploration geochemists
“eyeball” each uni-element data set in order to obtain impressions about the data
structure, behaviour, local densities, gaps and, of course, outliers. Descriptive statistics
and statistical graphics are the useful tools in “eyeballing” empirical density distributions
of uni-element data sets. Careful study of empirical density distributions of uni-element
data sets is very important in the analysis and modeling of geochemical anomalies.
In the study area, the empirical density distributions of each of the raw uni-element
data sets are all asymmetric, i.e., they are positively-skewed (or right-skewed) (Figs. 3-
10). In the individual raw uni-element data sets, the means are greater than the medians