
Page 65 - Geochemical Anomaly and Mineral Prospectivity Mapping in GIS
P. 65
64 Chapter 3
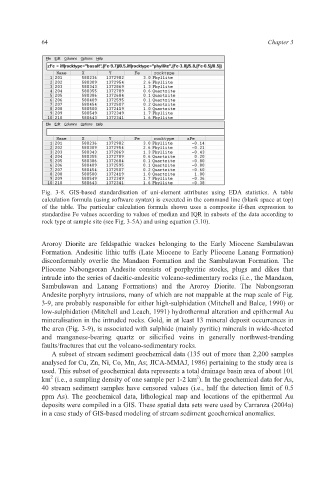
Fig. 3-8. GIS-based standardisation of uni-element attributes using EDA statistics. A table
calculation formula (using software syntax) is executed in the command line (blank space at top)
of the table. The particular calculation formula shown uses a composite if-then expression to
standardise Fe values according to values of median and IQR in subsets of the data according to
rock type at sample site (see Fig. 3-5A) and using equation (3.10).
Aroroy Diorite are feldspathic wackes belonging to the Early Miocene Sambulawan
Formation. Andesitic lithic tuffs (Late Miocene to Early Pliocene Lanang Formation)
disconformably overlie the Mandaon Formation and the Sambulawan Formation. The
Pliocene Nabongsoran Andesite consists of porphyritic stocks, plugs and dikes that
intrude into the series of dacitic-andesitic volcano-sedimentary rocks (i.e., the Mandaon,
Sambulawan and Lanang Formations) and the Aroroy Diorite. The Nabongsoran
Andesite porphyry intrusions, many of which are not mappable at the map scale of Fig.
3-9, are probably responsible for either high-sulphidation (Mitchell and Balce, 1990) or
low-sulphidation (Mitchell and Leach, 1991) hydrothermal alteration and epithermal Au
mineralisation in the intruded rocks. Gold, in at least 13 mineral deposit occurrences in
the area (Fig. 3-9), is associated with sulphide (mainly pyritic) minerals in wide-sheeted
and manganese-bearing quartz or silicified veins in generally northwest-trending
faults/fractures that cut the volcano-sedimentary rocks.
A subset of stream sediment geochemical data (135 out of more than 2,200 samples
analysed for Cu, Zn, Ni, Co, Mn, As; JICA-MMAJ, 1986) pertaining to the study area is
used. This subset of geochemical data represents a total drainage basin area of about 101
2
2
km (i.e., a sampling density of one sample per 1-2 km ). In the geochemical data for As,
40 stream sediment samples have censored values (i.e., half the detection limit of 0.5
ppm As). The geochemical data, lithological map and locations of the epithermal Au
deposits were compiled in a GIS. These spatial data sets were used by Carranza (2004a)
in a case study of GIS-based modeling of stream sediment geochemical anomalies.