
Page 68 - Geochemical Anomaly and Mineral Prospectivity Mapping in GIS
P. 68
Exploratory Analysis of Geochemical Anomalies 67
TABLE 3-I
Classical and EDA statistics of uni-element concentrations (in ppm) in the raw and log e -
transformed data for n=135 samples (except As*, for which n=95), Aroroy district (Philippines).
Mean SDEV Median MAD
Min. Max.
Raw Log e Raw Log e Raw Log e Taw Log e
Cu 8 200 64.04 3.98 37.84 0.62 56 4.03 20 0.38
Zn 13 230 56.90 3.90 32.43 0.52 52 3.95 18 0.37
Ni 3 42 12.59 2.37 6.86 0.59 12 2.48 5 0.40
Co 3 42 17.32 2.75 7.37 0.47 16 2.77 5 0.29
Mn 260 1800 769.93 6.55 345.69 0.45 660 6.49 230 0.37
As 0.25 82 4.62 0.34 10.62 1.49 1.5 0.41 1.25 1.14
As* 0.5 82 6.45 1.06 12.22 1.17 3.0 1.10 2.00 0.69
*without censored values.
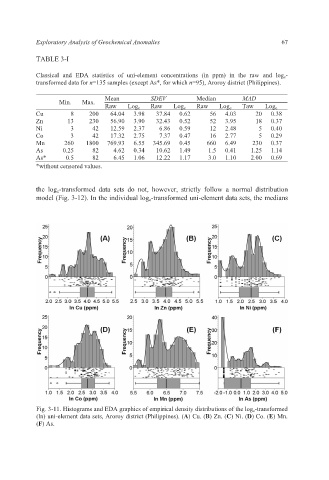
the log e-transformed data sets do not, however, strictly follow a normal distribution
model (Fig. 3-12). In the individual log e-transformed uni-element data sets, the medians
Fig. 3-11. Histograms and EDA graphics of empirical density distributions of the log e -transformed
(ln) uni-element data sets, Aroroy district (Philippines). (A) Cu. (B) Zn. (C) Ni. (D) Co. (E) Mn.
(F) As.