
Page 72 - Geochemical Anomaly and Mineral Prospectivity Mapping in GIS
P. 72
Exploratory Analysis of Geochemical Anomalies 71
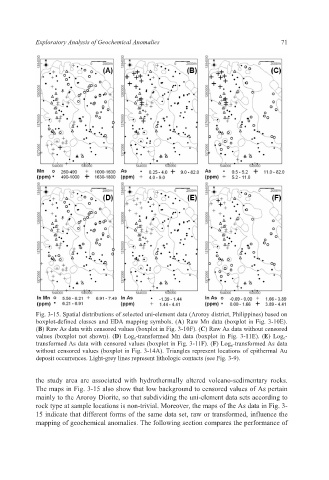
Fig. 3-15. Spatial distributions of selected uni-element data (Aroroy district, Philippines) based on
boxplot-defined classes and EDA mapping symbols. (A) Raw Mn data (boxplot in Fig. 3-10E).
(B) Raw As data with censored values (boxplot in Fig. 3-10F). (C) Raw As data without censored
values (boxplot not shown). (D) Log e -transformed Mn data (boxplot in Fig. 3-11E). (E) Log e -
transformed As data with censored values (boxplot in Fig. 3-11F). (F) Log e -transformed As data
without censored values (boxplot in Fig. 3-14A). Triangles represent locations of epithermal Au
deposit occurrences. Light-grey lines represent lithologic contacts (see Fig. 3-9).
the study area are associated with hydrothermally altered volcano-sedimentary rocks.
The maps in Fig. 3-15 also show that low background to censored values of As pertain
mainly to the Aroroy Diorite, so that subdividing the uni-element data sets according to
rock type at sample locations is non-trivial. Moreover, the maps of the As data in Fig. 3-
15 indicate that different forms of the same data set, raw or transformed, influence the
mapping of geochemical anomalies. The following section compares the performance of