
Page 75 - Geochemical Anomaly and Mineral Prospectivity Mapping in GIS
P. 75
74 Chapter 3
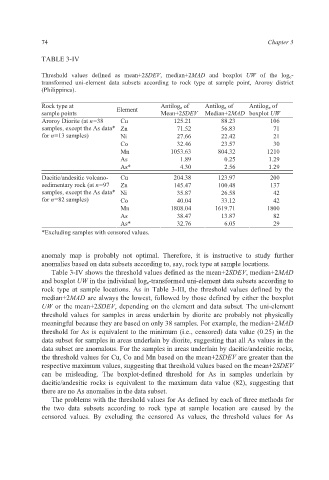
TABLE 3-IV
Threshold values defined as mean+2SDEV, median+2MAD and boxplot UW of the log e -
transformed uni-element data subsets according to rock type at sample point, Aroroy district
(Philippines).
Rock type at Element Antilog e of Antilog e of Antilog e of
sample points Mean+2SDEV Median+2MAD boxplot UW
Aroroy Diorite (at n=38 Cu 125.21 88.23 106
samples, except the As data* Zn 71.52 56.83 71
for n=13 samples) Ni 27.66 22.42 21
Co 32.46 23.57 30
Mn 1053.63 804.32 1210
As 1.89 0.25 1.29
As* 4.30 2.56 1.29
Dacitic/andesitic volcano- Cu 204.38 123.97 200
sedimentary rock (at n=97 Zn 145.47 100.48 137
samples, except the As data* Ni 35.87 26.58 42
for n=82 samples) Co 40.04 33.12 42
Mn 1808.04 1619.71 1800
As 38.47 13.87 82
As* 32.76 6.05 29
*Excluding samples with censored values.
anomaly map is probably not optimal. Therefore, it is instructive to study further
anomalies based on data subsets according to, say, rock type at sample locations.
Table 3-IV shows the threshold values defined as the mean+2SDEV, median+2MAD
and boxplot UW in the individual log e-transformed uni-element data subsets according to
rock type at sample locations. As in Table 3-III, the threshold values defined by the
median+2MAD are always the lowest, followed by those defined by either the boxplot
UW or the mean+2SDEV, depending on the element and data subset. The uni-element
threshold values for samples in areas underlain by diorite are probably not physically
meaningful because they are based on only 38 samples. For example, the median+2MAD
threshold for As is equivalent to the minimum (i.e., censored) data value (0.25) in the
data subset for samples in areas underlain by diorite, suggesting that all As values in the
data subset are anomalous. For the samples in areas underlain by dacitic/andesitic rocks,
the threshold values for Cu, Co and Mn based on the mean+2SDEV are greater than the
respective maximum values, suggesting that threshold values based on the mean+2SDEV
can be misleading. The boxplot-defined threshold for As in samples underlain by
dacitic/andesitic rocks is equivalent to the maximum data value (82), suggesting that
there are no As anomalies in the data subset.
The problems with the threshold values for As defined by each of three methods for
the two data subsets according to rock type at sample location are caused by the
censored values. By excluding the censored As values, the threshold values for As