
Page 71 - Geochemical Anomaly and Mineral Prospectivity Mapping in GIS
P. 71
70 Chapter 3
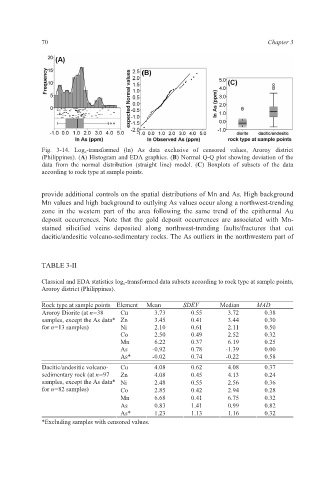
Fig. 3-14. Log e -transformed (ln) As data exclusive of censored values, Aroroy district
(Philippines). (A) Histogram and EDA graphics. (B) Normal Q-Q plot showing deviation of the
data from the normal distribution (straight line) model. (C) Boxplots of subsets of the data
according to rock type at sample points.
provide additional controls on the spatial distributions of Mn and As. High background
Mn values and high background to outlying As values occur along a northwest-trending
zone in the western part of the area following the same trend of the epithermal Au
deposit occurrences. Note that the gold deposit occurrences are associated with Mn-
stained silicified veins deposited along northwest-trending faults/fractures that cut
dacitic/andesitic volcano-sedimentary rocks. The As outliers in the northwestern part of
TABLE 3-II
Classical and EDA statistics log e -transformed data subsets according to rock type at sample points,
Aroroy district (Philippines).
Rock type at sample points Element Mean SDEV Median MAD
Aroroy Diorite (at n=38 Cu 3.73 0.55 3.72 0.38
samples, except the As data* Zn 3.45 0.41 3.44 0.30
for n=13 samples) Ni 2.10 0.61 2.11 0.50
Co 2.50 0.49 2.52 0.32
Mn 6.22 0.37 6.19 0.25
As -0.92 0.78 -1.39 0.00
As* -0.02 0.74 -0.22 0.58
Dacitic/andesitic volcano- Cu 4.08 0.62 4.08 0.37
sedimentary rock (at n=97 Zn 4.08 0.45 4.13 0.24
samples, except the As data* Ni 2.48 0.55 2.56 0.36
for n=82 samples) Co 2.85 0.42 2.94 0.28
Mn 6.68 0.41 6.75 0.32
As 0.83 1.41 0.99 0.82
As* 1.23 1.13 1.16 0.32
*Excluding samples with censored values.