
Page 73 - Geochemical Anomaly and Mineral Prospectivity Mapping in GIS
P. 73
72 Chapter 3
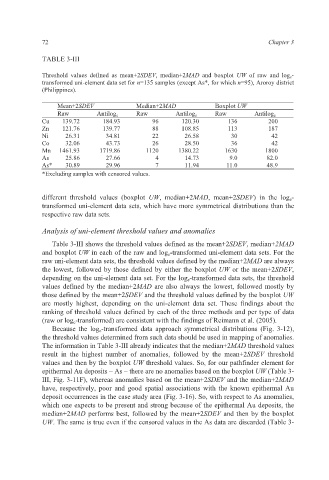
TABLE 3-III
Threshold values defined as mean+2SDEV, median+2MAD and boxplot UW of raw and log e -
transformed uni-element data set for n=135 samples (except As*, for which n=95), Aroroy district
(Philippines).
Mean+2SDEV Median+2MAD Boxplot UW
Raw Antilog e Raw Antilog e Raw Antilog e
Cu 139.72 184.93 96 120.30 136 200
Zn 121.76 139.77 88 108.85 113 187
Ni 26.31 34.81 22 26.58 30 42
Co 32.06 43.73 26 28.50 36 42
Mn 1461.93 1719.86 1120 1380.22 1630 1800
As 25.86 27.66 4 14.73 9.0 82.0
As* 30.89 29.96 7 11.94 11.0 48.9
*Excluding samples with censored values.
different threshold values (boxplot UW, median+2MAD, mean+2SDEV) in the log e-
transformed uni-element data sets, which have more symmetrical distributions than the
respective raw data sets.
Analysis of uni-element threshold values and anomalies
Table 3-III shows the threshold values defined as the mean+2SDEV, median+2MAD
and boxplot UW in each of the raw and log e-transformed uni-element data sets. For the
raw uni-element data sets, the threshold values defined by the median+2MAD are always
the lowest, followed by those defined by either the boxplot UW or the mean+2SDEV,
depending on the uni-element data set. For the log e-transformed data sets, the threshold
values defined by the median+2MAD are also always the lowest, followed mostly by
those defined by the mean+2SDEV and the threshold values defined by the boxplot UW
are mostly highest, depending on the uni-element data set. These findings about the
ranking of threshold values defined by each of the three methods and per type of data
(raw or log e-transformed) are consistent with the findings of Reimann et al. (2005).
Because the log e-transformed data approach symmetrical distributions (Fig. 3-12),
the threshold values determined from such data should be used in mapping of anomalies.
The information in Table 3-III already indicates that the median+2MAD threshold values
result in the highest number of anomalies, followed by the mean+2SDEV threshold
values and then by the boxplot UW threshold values. So, for our pathfinder element for
epithermal Au deposits – As – there are no anomalies based on the boxplot UW (Table 3-
III, Fig. 3-11F), whereas anomalies based on the mean+2SDEV and the median+2MAD
have, respectively, poor and good spatial associations with the known epithermal Au
deposit occurrences in the case study area (Fig. 3-16). So, with respect to As anomalies,
which one expects to be present and strong because of the epithermal Au deposits, the
median+2MAD performs best, followed by the mean+2SDEV and then by the boxplot
UW. The same is true even if the censored values in the As data are discarded (Table 3-