
Page 78 - Geochemical Anomaly and Mineral Prospectivity Mapping in GIS
P. 78
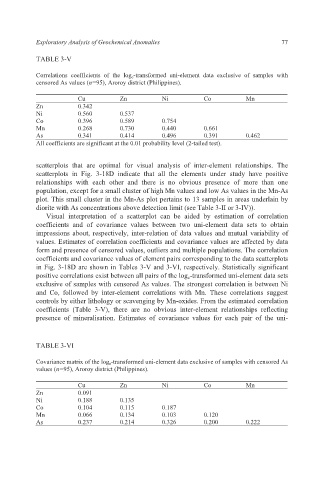
Exploratory Analysis of Geochemical Anomalies                         77

           TABLE 3-V

           Correlations coefficients of the log e -transformed uni-element  data exclusive  of samples with
           censored As values (n=95), Aroroy district (Philippines).

                       Cu          Zn          Ni          Co          Mn
           Zn          0.342
           Ni          0.560       0.537
           Co          0.396       0.589       0.754
           Mn          0.268       0.730       0.440       0.661
           As          0.341       0.414       0.496       0.391       0.462
           All coefficients are significant at the 0.01 probability level (2-tailed test).

           scatterplots that are optimal for  visual analysis of inter-element relationships. The
           scatterplots in Fig. 3-18D indicate that  all the elements under study have  positive
           relationships  with each other and there is no  obvious presence of more than one
           population, except for a small cluster of high Mn values and low As values in the Mn-As
           plot. This small cluster in the Mn-As plot pertains to 13 samples in areas underlain by
           diorite with As concentrations above detection limit (see Table 3-II or 3-IV)).
              Visual interpretation of a scatterplot can  be aided by estimation of correlation
           coefficients and  of covariance values  between two  uni-element data sets to obtain
           impressions about, respectively, inter-relation of data values and mutual variability of
           values. Estimates of correlation coefficients and covariance values are affected by data
           form and presence of censored values, outliers and multiple populations. The correlation
           coefficients and covariance values of element pairs corresponding to the data scatterplots
           in Fig. 3-18D are shown in Tables 3-V and 3-VI, respectively. Statistically significant
           positive correlations exist between all pairs of the log e-transformed uni-element data sets
           exclusive of samples with censored As values. The strongest correlation is between Ni
           and Co,  followed  by inter-element correlations  with Mn. These correlations suggest
           controls by either lithology or scavenging by Mn-oxides. From the estimated correlation
           coefficients (Table 3-V), there are no obvious inter-element relationships reflecting
           presence of  mineralisation. Estimates of covariance values for each  pair of the  uni-


           TABLE 3-VI

           Covariance matrix of the log e -transformed uni-element data exclusive of samples with censored As
           values (n=95), Aroroy district (Philippines).

                       Cu          Zn          Ni          Co          Mn
           Zn          0.091
           Ni          0.188       0.135
           Co          0.104       0.115       0.187
           Mn          0.066       0.134       0.103       0.120
           As          0.237       0.214       0.326       0.200       0.222