
Page 82 - Geochemical Anomaly and Mineral Prospectivity Mapping in GIS
P. 82
Exploratory Analysis of Geochemical Anomalies 81
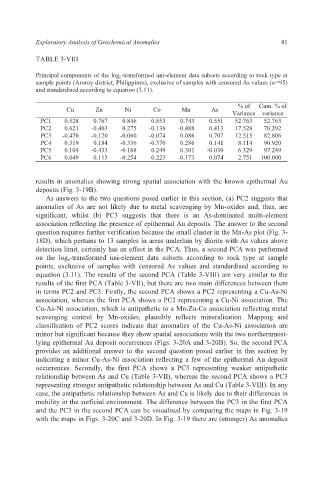
TABLE 3-VIII
Principal components of the log e -transformed uni-element data subsets according to rock type at
sample points (Aroroy district, Philippines), exclusive of samples with censored As values (n=95)
and standardised according to equation (3.11).
% of Cum. % of
Cu Zn Ni Co Mn As
Variance variance
PC1 0.528 0.767 0.846 0.853 0.743 0.551 52.763 52.763
PC2 0.621 -0.403 0.275 -0.136 -0.488 0.413 17.528 70.292
PC3 -0.470 -0.120 -0.060 -0.074 0.086 0.707 12.515 82.806
PC4 0.319 0.184 -0.336 -0.370 0.286 0.141 8.114 90.920
PC5 0.104 -0.433 -0.168 0.249 0.301 -0.030 6.329 97.249
PC6 0.049 0.113 -0.254 0.223 -0.173 0.074 2.751 100.000
results in anomalies showing strong spatial association with the known epithermal Au
deposits (Fig. 3-19B).
As answers to the two questions posed earlier in this section, (a) PC2 suggests that
anomalies of As are not likely due to metal scavenging by Mn-oxides and, thus, are
significant, whilst (b) PC3 suggests that there is an As-dominated multi-element
association reflecting the presence of epithermal Au deposits. The answer to the second
question requires further verification because the small cluster in the Mn-As plot (Fig. 3-
18D), which pertains to 13 samples in areas underlain by diorite with As values above
detection limit, certainly has an effect in the PCA. Thus, a second PCA was performed
on the log e-transformed uni-element data subsets according to rock type at sample
points, exclusive of samples with censored As values and standardised according to
equation (3.11). The results of the second PCA (Table 3-VIII) are very similar to the
results of the first PCA (Table 3-VII), but there are two main differences between them
in terms PC2 and PC3. Firstly, the second PCA shows a PC2 representing a Cu-As-Ni
association, whereas the first PCA shows a PC2 representing a Cu-Ni association. The
Cu-As-Ni association, which is antipathetic to a Mn-Zn-Co association reflecting metal
scavenging control by Mn-oxides, plausibly reflects mineralisation. Mapping and
classification of PC2 scores indicate that anomalies of the Cu-As-Ni association are
minor but significant because they show spatial associations with the two northernmost-
lying epithermal Au deposit occurrences (Figs. 3-20A and 3-20B). So, the second PCA
provides an additional answer to the second question posed earlier in this section by
indicating a minor Cu-As-Ni association reflecting a few of the epithermal Au deposit
occurrences. Secondly, the first PCA shows a PC3 representing weaker antipathetic
relationship between As and Cu (Table 3-VII), whereas the second PCA shows a PC3
representing stronger antipathetic relationship between As and Cu (Table 3-VIII). In any
case, the antipathetic relationship between As and Cu is likely due to their differences in
mobility in the surficial environment. The difference between the PC3 in the first PCA
and the PC3 in the second PCA can be visualised by comparing the maps in Fig. 3-19
with the maps in Figs. 3-20C and 3-20D. In Fig. 3-19 there are (stronger) As anomalies