
Page 62 - Geochemical Anomaly and Mineral Prospectivity Mapping in GIS
P. 62
Exploratory Analysis of Geochemical Anomalies 61
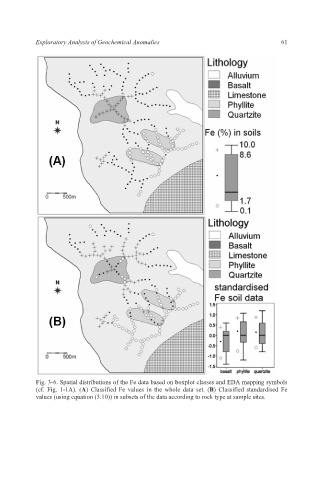
Fig. 3-6. Spatial distributions of the Fe data based on boxplot classes and EDA mapping symbols
(cf. Fig. 1-1A). (A) Classified Fe values in the whole data set. (B) Classified standardised Fe
values (using equation (3.10)) in subsets of the data according to rock type at sample sites.