
Page 107 - Geochemical Anomaly and Mineral Prospectivity Mapping in GIS
P. 107
106 Chapter 4
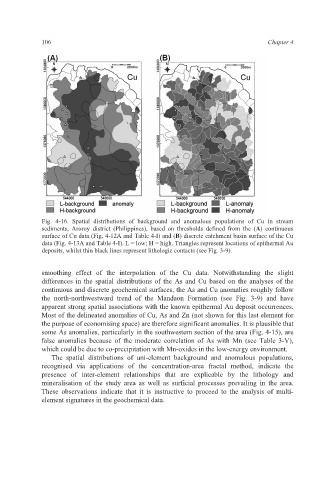
Fig. 4-16. Spatial distributions of background and anomalous populations of Cu in stream
sediments, Aroroy district (Philippines), based on thresholds defined from the (A) continuous
surface of Cu data (Fig. 4-12A and Table 4-I) and (B) discrete catchment basin surface of the Cu
data (Fig. 4-13A and Table 4-I). L = low; H = high. Triangles represent locations of epithermal Au
deposits, whilst thin black lines represent lithologic contacts (see Fig. 3-9).
smoothing effect of the interpolation of the Cu data. Notwithstanding the slight
differences in the spatial distributions of the As and Cu based on the analyses of the
continuous and discrete geochemical surfaces, the As and Cu anomalies roughly follow
the north-northwestward trend of the Mandaon Formation (see Fig. 3-9) and have
apparent strong spatial associations with the known epithermal Au deposit occurrences.
Most of the delineated anomalies of Cu, As and Zn (not shown for this last element for
the purpose of economising space) are therefore significant anomalies. It is plausible that
some As anomalies, particularly in the southwestern section of the area (Fig. 4-15), are
false anomalies because of the moderate correlation of As with Mn (see Table 3-V),
which could be due to co-precipitation with Mn-oxides in the low-energy environment.
The spatial distributions of uni-element background and anomalous populations,
recognised via applications of the concentration-area fractal method, indicate the
presence of inter-element relationships that are explicable by the lithology and
mineralisation of the study area as well as surficial processes prevailing in the area.
These observations indicate that it is instructive to proceed to the analysis of multi-
element signatures in the geochemical data.