
Page 110 - Geochemical Anomaly and Mineral Prospectivity Mapping in GIS
P. 110
Fractal Analysis of Geochemical Anomalies 109
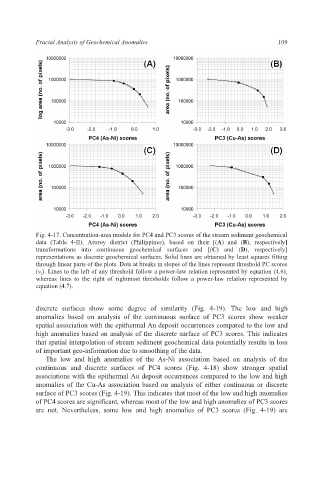
Fig. 4-17. Concentration-area models for PC4 and PC3 scores of the stream sediment geochemical
data (Table 4-II), Aroroy district (Philippines), based on their [(A) and (B), respectively]
transformations into continuous geochemical surfaces and [(C) and (D), respectively]
representations as discrete geochemical surfaces. Solid lines are obtained by least squares fitting
through linear parts of the plots. Dots at breaks in slopes of the lines represent threshold PC scores
(v t ). Lines to the left of any threshold follow a power-law relation represented by equation (4.6),
whereas lines to the right of rightmost thresholds follow a power-law relation represented by
equation (4.7).
discrete surfaces show some degree of similarity (Fig. 4-19). The low and high
anomalies based on analysis of the continuous surface of PC3 scores show weaker
spatial association with the epithermal Au deposit occurrences compared to the low and
high anomalies based on analysis of the discrete surface of PC3 scores. This indicates
that spatial interpolation of stream sediment geochemical data potentially results in loss
of important geo-information due to smoothing of the data.
The low and high anomalies of the As-Ni association based on analysis of the
continuous and discrete surfaces of PC4 scores (Fig. 4-18) show stronger spatial
associations with the epithermal Au deposit occurrences compared to the low and high
anomalies of the Cu-As association based on analysis of either continuous or discrete
surface of PC3 scores (Fig. 4-19). This indicates that most of the low and high anomalies
of PC4 scores are significant, whereas most of the low and high anomalies of PC3 scores
are not. Nevertheless, some low and high anomalies of PC3 scores (Fig. 4-19) are