
Page 220 - Geochemical Anomaly and Mineral Prospectivity Mapping in GIS
P. 220
222 Chapter 7
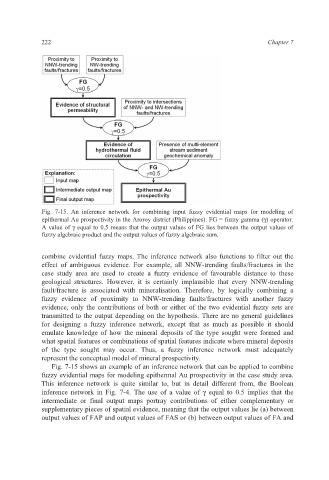
Fig. 7-15. An inference network for combining input fuzzy evidential maps for modeling of
epithermal Au prospectivity in the Aroroy district (Philippines). FG = fuzzy gamma (γ) operator.
A value of γ equal to 0.5 means that the output values of FG lies between the output values of
fuzzy algebraic product and the output values of fuzzy algebraic sum.
combine evidential fuzzy maps. The inference network also functions to filter out the
effect of ambiguous evidence. For example, all NNW-trending faults/fractures in the
case study area are used to create a fuzzy evidence of favourable distance to these
geological structures. However, it is certainly implausible that every NNW-trending
fault/fracture is associated with mineralisation. Therefore, by logically combining a
fuzzy evidence of proximity to NNW-trending faults/fractures with another fuzzy
evidence, only the contributions of both or either of the two evidential fuzzy sets are
transmitted to the output depending on the hypothesis. There are no general guidelines
for designing a fuzzy inference network, except that as much as possible it should
emulate knowledge of how the mineral deposits of the type sought were formed and
what spatial features or combinations of spatial features indicate where mineral deposits
of the type sought may occur. Thus, a fuzzy inference network must adequately
represent the conceptual model of mineral prospectivity.
Fig. 7-15 shows an example of an inference network that can be applied to combine
fuzzy evidential maps for modeling epithermal Au prospectivity in the case study area.
This inference network is quite similar to, but in detail different from, the Boolean
inference network in Fig. 7-4. The use of a value of γ equal to 0.5 implies that the
intermediate or final output maps portray contributions of either complementary or
supplementary pieces of spatial evidence, meaning that the output values lie (a) between
output values of FAP and output values of FAS or (b) between output values of FA and