
Page 221 - Geochemical Anomaly and Mineral Prospectivity Mapping in GIS
P. 221
Knowledge-Driven Modeling of Mineral Prospectivity 223
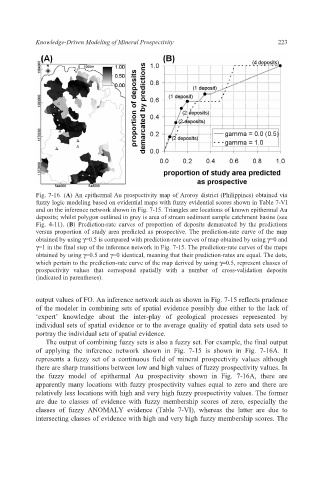
Fig. 7-16. (A) An epithermal Au prospectivity map of Aroroy district (Philippines) obtained via
fuzzy logic modeling based on evidential maps with fuzzy evidential scores shown in Table 7-VI
and on the inference network shown in Fig. 7-15. Triangles are locations of known epithermal Au
deposits; whilst polygon outlined in grey is area of stream sediment sample catchment basins (see
Fig. 4-11). (B) Prediction-rate curves of proportion of deposits demarcated by the predictions
versus proportion of study area predicted as prospective. The prediction-rate curve of the map
obtained by using γ=0.5 is compared with prediction-rate curves of map obtained by using γ=0 and
γ=1 in the final step of the inference network in Fig. 7-15. The prediction-rate curves of the maps
obtained by using γ=0.5 and γ=0 identical, meaning that their prediction-rates are equal. The dots,
which pertain to the prediction-rate curve of the map derived by using γ=0.5, represent classes of
prospectivity values that correspond spatially with a number of cross-validation deposits
(indicated in parentheses).
output values of FO. An inference network such as shown in Fig. 7-15 reflects prudence
of the modeler in combining sets of spatial evidence possibly due either to the lack of
‘expert’ knowledge about the inter-play of geological processes represented by
individual sets of spatial evidence or to the average quality of spatial data sets used to
portray the individual sets of spatial evidence.
The output of combining fuzzy sets is also a fuzzy set. For example, the final output
of applying the inference network shown in Fig. 7-15 is shown in Fig. 7-16A. It
represents a fuzzy set of a continuous field of mineral prospectivity values although
there are sharp transitions between low and high values of fuzzy prospectivity values. In
the fuzzy model of epithermal Au prospectivity shown in Fig. 7-16A, there are
apparently many locations with fuzzy prospectivity values equal to zero and there are
relatively less locations with high and very high fuzzy prospectivity values. The former
are due to classes of evidence with fuzzy membership scores of zero, especially the
classes of fuzzy ANOMALY evidence (Table 7-VI), whereas the latter are due to
intersecting classes of evidence with high and very high fuzzy membership scores. The