
Page 228 - Geochemical Anomaly and Mineral Prospectivity Mapping in GIS
P. 228
230 Chapter 7
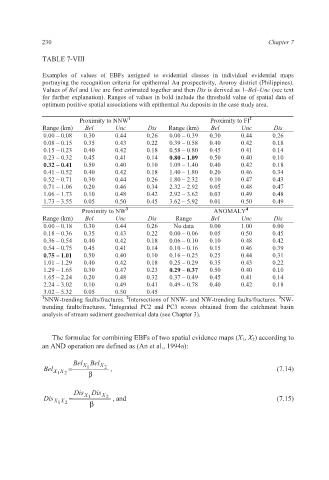
TABLE 7-VIII
Examples of values of EBFs assigned to evidential classes in individual evidential maps
portraying the recognition criteria for epithermal Au prospectivity, Aroroy district (Philippines).
Values of Bel and Unc are first estimated together and then Dis is derived as 1–Bel–Unc (see text
for further explanation). Ranges of values in bold include the threshold value of spatial data of
optimum positive spatial associations with epithermal Au deposits in the case study area.
2
Proximity to NNW 1 Proximity to FI
Range (km) Bel Unc Dis Range (km) Bel Unc Dis
0.00 – 0.08 0.30 0.44 0.26 0.00 – 0.39 0.30 0.44 0.26
0.08 – 0.15 0.35 0.43 0.22 0.39 – 0.58 0.40 0.42 0.18
0.15 – 0.23 0.40 0.42 0.18 0.58 – 0.80 0.45 0.41 0.14
0.23 – 0.32 0.45 0.41 0.14 0.80 – 1.09 0.50 0.40 0.10
0.32 – 0.41 0.50 0.40 0.10 1.09 – 1.40 0.40 0.42 0.18
0.41 – 0.52 0.40 0.42 0.18 1.40 – 1.80 0.20 0.46 0.34
0.52 – 0.71 0.30 0.44 0.26 1.80 – 2.32 0.10 0.47 0.43
0.71 – 1.06 0.20 0.46 0.34 2.32 – 2.92 0.05 0.48 0.47
1.06 – 1.73 0.10 0.48 0.42 2.92 – 3.62 0.03 0.49 0.48
1.73 – 3.55 0.05 0.50 0.45 3.62 – 5.92 0.01 0.50 0.49
4
Proximity to NW 3 ANOMALY
Range (km) Bel Unc Dis Range Bel Unc Dis
0.00 – 0.18 0.30 0.44 0.26 No data 0.00 1.00 0.00
0.18 – 0.36 0.35 0.43 0.22 0.00 – 0.06 0.05 0.50 0.45
0.36 – 0.54 0.40 0.42 0.18 0.06 – 0.10 0.10 0.48 0.42
0.54 – 0.75 0.45 0.41 0.14 0.10 – 0.16 0.15 0.46 0.39
0.75 – 1.01 0.50 0.40 0.10 0.16 – 0.25 0.25 0.44 0.31
1.01 – 1.29 0.40 0.42 0.18 0.25 – 0.29 0.35 0.43 0.22
1.29 – 1.65 0.30 0.47 0.23 0.29 – 0.37 0.50 0.40 0.10
1.65 – 2.24 0.20 0.48 0.32 0.37 – 0.49 0.45 0.41 0.14
2.24 – 3.02 0.10 0.49 0.41 0.49 – 0.78 0.40 0.42 0.18
3.02 – 5.32 0.05 0.50 0.45
1 NNW-trending faults/fractures. Intersections of NNW- and NW-trending faults/fractures. NW-
2
3
4
trending faults/fractures. Integrated PC2 and PC3 scores obtained from the catchment basin
analysis of stream sediment geochemical data (see Chapter 3).
The formulae for combining EBFs of two spatial evidence maps (X 1, X 2) according to
an AND operation are defined as (An et al., 1994a):
Bel Bel
Bel X 1 X 2 = X 1 β X 2 , (7.14)
Dis Dis
Dis X 1 X 2 = X 1 β X 2 , and (7.15)