
Page 231 - Geochemical Anomaly and Mineral Prospectivity Mapping in GIS
P. 231
Knowledge-Driven Modeling of Mineral Prospectivity 233
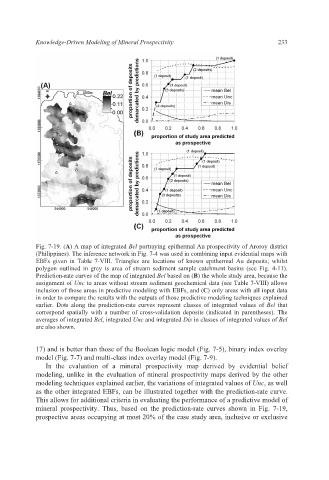
Fig. 7-19. (A) A map of integrated Bel portraying epithermal Au prospectivity of Aroroy district
(Philippines). The inference network in Fig. 7-4 was used in combining input evidential maps with
EBFs given in Table 7-VIII. Triangles are locations of known epithermal Au deposits; whilst
polygon outlined in grey is area of stream sediment sample catchment basins (see Fig. 4-11).
Prediction-rate curves of the map of integrated Bel based on (B) the whole study area, because the
assignment of Unc to areas without stream sediment geochemical data (see Table 7-VIII) allows
inclusion of those areas in predictive modeling with EBFs, and (C) only areas with all input data
in order to compare the results with the outputs of those predictive modeling techniques explained
earlier. Dots along the prediction-rate curves represent classes of integrated values of Bel that
correspond spatially with a number of cross-validation deposits (indicated in parentheses). The
averages of integrated Bel, integrated Unc and integrated Dis in classes of integrated values of Bel
are also shown.
17) and is better than those of the Boolean logic model (Fig. 7-5), binary index overlay
model (Fig. 7-7) and multi-class index overlay model (Fig. 7-9).
In the evaluation of a mineral prospectivity map derived by evidential belief
modeling, unlike in the evaluation of mineral prospectivity maps derived by the other
modeling techniques explained earlier, the variations of integrated values of Unc, as well
as the other integrated EBFs, can be illustrated together with the prediction-rate curve.
This allows for additional criteria in evaluating the performance of a predictive model of
mineral prospectivity. Thus, based on the prediction-rate curves shown in Fig. 7-19,
prospective areas occupying at most 20% of the case study area, inclusive or exclusive