
Page 236 - Geochemical Anomaly and Mineral Prospectivity Mapping in GIS
P. 236
238 Chapter 7
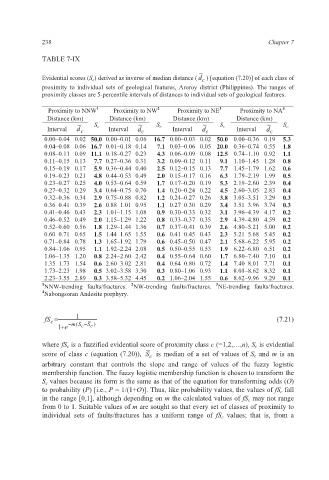
TABLE 7-IX
~
Evidential scores (S c ) derived as inverse of median distance ( d ) [equation (7.20)] of each class of
c
proximity to individual sets of geological features, Aroroy district (Philippines). The ranges of
proximity classes are 5-percentile intervals of distances to individual sets of geological features.
4
Proximity to NNW 1 Proximity to NW 2 Proximity to NE 3 Proximity to NA
Distance (km) Distance (km) Distance (km) Distance (km)
~ S c ~ S c ~ S c ~ S c
Interval d c Interval d Interval d Interval d
c
c
c
0.00–0.04 0.02 50.0 0.00–0.01 0.06 16.7 0.00–0.03 0.02 50.0 0.00–0.36 0.19 5.3
0.04–0.08 0.06 16.7 0.01–0.18 0.14 7.1 0.03–0.06 0.05 20.0 0.36–0.74 0.55 1.8
0.08–0.11 0.09 11.1 0.18–0.27 0.23 4.3 0.06–0.09 0.08 12.5 0.74–1.10 0.92 1.1
0.11–0.15 0.13 7.7 0.27–0.36 0.31 3.2 0.09–0.12 0.11 9.1 1.10–1.45 1.28 0.8
0.15–0.19 0.17 5.9 0.36–0.44 0.40 2.5 0.12–0.15 0.13 7.7 1.45–1.79 1.62 0.6
0.19–0.23 0.21 4.8 0.44–0.53 0.49 2.0 0.15–0.17 0.16 6.3 1.79–2.19 1.99 0.5
0.23–0.27 0.25 4.0 0.53–0.64 0.59 1.7 0.17–0.20 0.19 5.3 2.19–2.60 2.39 0.4
0.27–0.32 0.29 3.4 0.64–0.75 0.70 1.4 0.20–0.24 0.22 4.5 2.60–3.05 2.83 0.4
0.32–0.36 0.34 2.9 0.75–0.88 0.82 1.2 0.24–0.27 0.26 3.8 3.05–3.51 3.29 0.3
0.36–0.41 0.39 2.6 0.88–1.01 0.95 1.1 0.27–0.30 0.29 3.4 3.51–3.96 3.74 0.3
0.41–0.46 0.43 2.3 1.01–1.15 1.08 0.9 0.30–0.33 0.32 3.1 3.96–4.39 4.17 0.2
0.46–0.52 0.49 2.0 1.15–1.29 1.22 0.8 0.33–0.37 0.35 2.9 4.39–4.80 4.59 0.2
0.52–0.60 0.56 1.8 1.29–1.44 1.36 0.7 0.37–0.41 0.39 2.6 4.80–5.21 5.00 0.2
0.60–0.71 0.65 1.5 1.44–1.65 1.55 0.6 0.41–0.45 0.43 2.3 5.21–5.68 5.45 0.2
0.71–0.84 0.78 1.3 1.65–1.92 1.79 0.6 0.45–0.50 0.47 2.1 5.68–6.22 5.95 0.2
0.84–1.06 0.95 1.1 1.92–2.24 2.08 0.5 0.50–0.55 0.53 1.9 6.22–6.80 6.51 0.2
1.06–1.35 1.20 0.8 2.24–2.60 2.42 0.4 0.55–0.64 0.60 1.7 6.80–7.40 7.10 0.1
1.35–1.73 1.54 0.6 2.60–3.02 2.81 0.4 0.64–0.80 0.72 1.4 7.40–8.01 7.71 0.1
1.73–2.23 1.98 0.5 3.02–3.58 3.30 0.3 0.80–1.06 0.93 1.1 8.01–8.62 8.32 0.1
2.23–3.55 2.89 0.3 3.58–5.32 4.45 0.2 1.06–2.04 1.55 0.6 8.62–9.96 9.29 0.1
2
3
1 NNW-trending faults/fractures. NW-trending faults/fractures. NE-trending faults/fractures.
4 Nabongsoran Andesite porphyry.
fS = 1 ~ (7.21)
c
−
S
+
1 e − m ( c S c )
where fS c is a fuzzified evidential score of proximity class c (=1,2,…,n), S c is evidential
~
score of class c (equation (7.20)), S is median of a set of values of S c and m is an
c
arbitrary constant that controls the slope and range of values of the fuzzy logistic
membership function. The fuzzy logistic membership function is chosen to transform the
S c values because its form is the same as that of the equation for transforming odds (O)
to probability (P) [i.e., P = 1/(1+O)]. Thus, like probability values, the values of fS c fall
in the range [0,1], although depending on m the calculated values of fS c may not range
from 0 to 1. Suitable values of m are sought so that every set of classes of proximity to
individual sets of faults/fractures has a uniform range of fS c values; that is, from a