
Page 240 - Geochemical Anomaly and Mineral Prospectivity Mapping in GIS
P. 240
242 Chapter 7
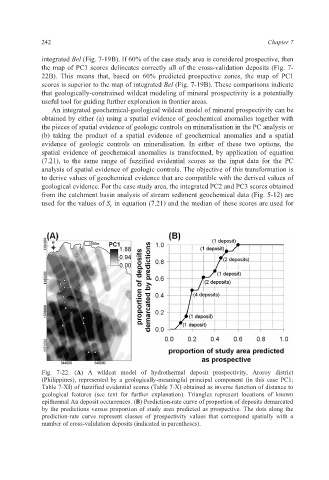
integrated Bel (Fig. 7-19B). If 60% of the case study area is considered prospective, then
the map of PC1 scores delineates correctly all of the cross-validation deposits (Fig. 7-
22B). This means that, based on 60% predicted prospective zones, the map of PC1
scores is superior to the map of integrated Bel (Fig. 7-19B). These comparisons indicate
that geologically-constrained wildcat modeling of mineral prospectivity is a potentially
useful tool for guiding further exploration in frontier areas.
An integrated geochemical-geological wildcat model of mineral prospectivity can be
obtained by either (a) using a spatial evidence of geochemical anomalies together with
the pieces of spatial evidence of geologic controls on mineralisation in the PC analysis or
(b) taking the product of a spatial evidence of geochemical anomalies and a spatial
evidence of geologic controls on mineralisation. In either of these two options, the
spatial evidence of geochemical anomalies is transformed, by application of equation
(7.21), to the same range of fuzzified evidential scores as the input data for the PC
analysis of spatial evidence of geologic controls. The objective of this transformation is
to derive values of geochemical evidence that are compatible with the derived values of
geological evidence. For the case study area, the integrated PC2 and PC3 scores obtained
from the catchment basin analysis of stream sediment geochemical data (Fig. 5-12) are
used for the values of S c in equation (7.21) and the median of these scores are used for
Fig. 7-22. (A) A wildcat model of hydrothermal deposit prospectivity, Aroroy district
(Philippines), represented by a geologically-meaningful principal component (in this case PC1;
Table 7-XI) of fuzzified evidential scores (Table 7-X) obtained as inverse function of distance to
geological features (see text for further explanation). Triangles represent locations of known
epithermal Au deposit occurrences. (B) Prediction-rate curve of proportion of deposits demarcated
by the predictions versus proportion of study area predicted as prospective. The dots along the
prediction-rate curve represent classes of prospectivity values that correspond spatially with a
number of cross-validation deposits (indicated in parentheses).