
Page 241 - Geochemical Anomaly and Mineral Prospectivity Mapping in GIS
P. 241
Knowledge-Driven Modeling of Mineral Prospectivity 243
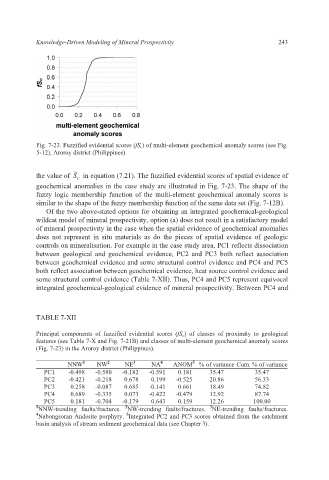
Fig. 7-23. Fuzzified evidential scores (fS c ) of multi-element geochemical anomaly scores (see Fig.
5-12), Aroroy district (Philippines).
~
the value of S in equation (7.21). The fuzzified evidential scores of spatial evidence of
c
geochemical anomalies in the case study are illustrated in Fig. 7-23. The shape of the
fuzzy logic membership function of the multi-element geochemical anomaly scores is
similar to the shape of the fuzzy membership function of the same data set (Fig. 7-12B).
Of the two above-stated options for obtaining an integrated geochemical-geological
wildcat model of mineral prospectivity, option (a) does not result in a satisfactory model
of mineral prospectivity in the case when the spatial evidence of geochemical anomalies
does not represent in situ materials as do the pieces of spatial evidence of geologic
controls on mineralisation. For example in the case study area, PC1 reflects dissociation
between geological and geochemical evidence, PC2 and PC3 both reflect association
between geochemical evidence and some structural control evidence and PC4 and PC5
both reflect association between geochemical evidence, heat source control evidence and
some structural control evidence (Table 7-XII). Thus, PC4 and PC5 represent equivocal
integrated geochemical-geological evidence of mineral prospectivity. Between PC4 and
TABLE 7-XII
Principal components of fuzzified evidential scores (fS c ) of classes of proximity to geological
features (see Table 7-X and Fig. 7-21B) and classes of multi-element geochemical anomaly scores
(Fig. 7-23) in the Aroroy district (Philippines).
NNW 1 NW 2 NE 3 NA 4 ANOM 5 % of variance Cum. % of variance
PC1 -0.498 -0.580 -0.182 -0.591 0.181 35.47 35.47
PC2 -0.421 -0.218 0.678 0.199 -0.525 20.86 56.33
PC3 0.258 -0.087 0.685 -0.141 0.661 18.49 74.82
PC4 0.689 -0.335 0.073 -0.422 -0.479 12.92 87.74
PC5 0.181 -0.704 -0.179 0.643 0.159 12.26 100.00
3
2
1 NNW-trending faults/fractures. NW-trending faults/fractures. NE-trending faults/fractures.
5
4 Nabongsoran Andesite porphyry. Integrated PC2 and PC3 scores obtained from the catchment
basin analysis of stream sediment geochemical data (see Chapter 3).