
Page 242 - Geochemical Anomaly and Mineral Prospectivity Mapping in GIS
P. 242
244 Chapter 7
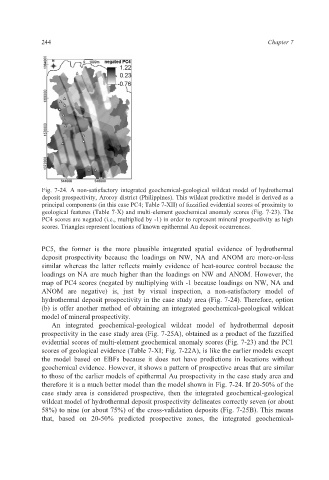
Fig. 7-24. A non-satisfactory integrated geochemical-geological wildcat model of hydrothermal
deposit prospectivity, Aroroy district (Philippines). This wildcat predictive model is derived as a
principal components (in this case PC4; Table 7-XII) of fuzzified evidential scores of proximity to
geological features (Table 7-X) and multi-element geochemical anomaly scores (Fig. 7-23). The
PC4 scores are negated (i.e., multiplied by -1) in order to represent mineral prospectivity as high
scores. Triangles represent locations of known epithermal Au deposit occurrences.
PC5, the former is the more plausible integrated spatial evidence of hydrothermal
deposit prospectivity because the loadings on NW, NA and ANOM are more-or-less
similar whereas the latter reflects mainly evidence of heat-source control because the
loadings on NA are much higher than the loadings on NW and ANOM. However, the
map of PC4 scores (negated by multiplying with -1 because loadings on NW, NA and
ANOM are negative) is, just by visual inspection, a non-satisfactory model of
hydrothermal deposit prospectivity in the case study area (Fig. 7-24). Therefore, option
(b) is offer another method of obtaining an integrated geochemical-geological wildcat
model of mineral prospectivity.
An integrated geochemical-geological wildcat model of hydrothermal deposit
prospectivity in the case study area (Fig. 7-25A), obtained as a product of the fuzzified
evidential scores of multi-element geochemical anomaly scores (Fig. 7-23) and the PC1
scores of geological evidence (Table 7-XI; Fig. 7-22A), is like the earlier models except
the model based on EBFs because it does not have predictions in locations without
geochemical evidence. However, it shows a pattern of prospective areas that are similar
to those of the earlier models of epithermal Au prospectivity in the case study area and
therefore it is a much better model than the model shown in Fig. 7-24. If 20-50% of the
case study area is considered prospective, then the integrated geochemical-geological
wildcat model of hydrothermal deposit prospectivity delineates correctly seven (or about
58%) to nine (or about 75%) of the cross-validation deposits (Fig. 7-25B). This means
that, based on 20-50% predicted prospective zones, the integrated geochemical-