
Page 252 - Geochemical Anomaly and Mineral Prospectivity Mapping in GIS
P. 252
Data-Driven Modeling of Mineral Prospectivity 255
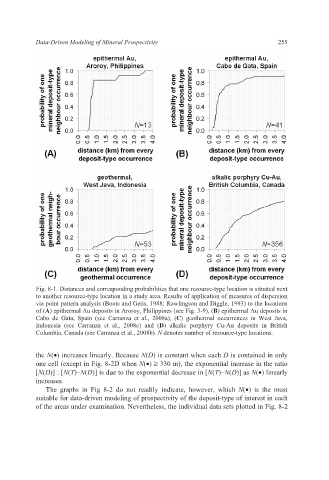
Fig. 8-1. Distances and corresponding probabilities that one resource-type location is situated next
to another resource-type location in a study area. Results of application of measures of dispersion
via point pattern analysis (Boots and Getis, 1988; Rowlingson and Diggle, 1993) to the locations
of (A) epithermal Au deposits in Aroroy, Philippines (see Fig. 3-9), (B) epithermal Au deposits in
Cabo de Gata, Spain (see Carranza et al., 2008a), (C) geothermal occurrences in West Java,
Indonesia (see Carranza et al., 2008c) and (D) alkalic porphyry Cu-Au deposits in British
Columbia, Canada (see Carranza et al., 2008b). N denotes number of resource-type locations.
the N(•) increases linearly. Because N(D) is constant when each D is contained in only
one cell (except in Fig. 8-2D when N(•) ≥ 330 m), the exponential increase in the ratio
[N(D)] : [N(T)–N(D)] is due to the exponential decrease in [N(T)–N(D)] as N(•) linearly
increases.
The graphs in Fig 8-2 do not readily indicate, however, which N(•) is the most
suitable for data-driven modeling of prospectivity of the deposit-type of interest in each
of the areas under examination. Nevertheless, the individual data sets plotted in Fig. 8-2