
Page 254 - Geochemical Anomaly and Mineral Prospectivity Mapping in GIS
P. 254
Data-Driven Modeling of Mineral Prospectivity 257
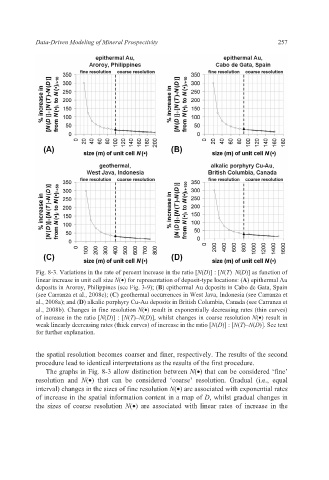
Fig. 8-3. Variations in the rate of percent increase in the ratio [N(D)] : [N(T)–N(D)] as function of
linear increase in unit cell size N(•) for representation of deposit-type locations: (A) epithermal Au
deposits in Aroroy, Philippines (see Fig. 3-9); (B) epithermal Au deposits in Cabo de Gata, Spain
(see Carranza et al., 2008c); (C) geothermal occurrences in West Java, Indonesia (see Carranza et
al., 2008a); and (D) alkalic porphyry Cu-Au deposits in British Columbia, Canada (see Carranza et
al., 2008b). Changes in fine resolution N(•) result in exponentially decreasing rates (thin curves)
of increase in the ratio [N(D)] : [N(T)–N(D)], whilst changes in coarse resolution N(•) result in
weak linearly decreasing rates (thick curves) of increase in the ratio [N(D)] : [N(T)–N(D)]. See text
for further explanation.
the spatial resolution becomes coarser and finer, respectively. The results of the second
procedure lead to identical interpretations as the results of the first procedure.
The graphs in Fig. 8-3 allow distinction between N(•) that can be considered ‘fine’
resolution and N(•) that can be considered ‘coarse’ resolution. Gradual (i.e., equal
interval) changes in the sizes of fine resolution N(•) are associated with exponential rates
of increase in the spatial information content in a map of D, whilst gradual changes in
the sizes of coarse resolution N(•) are associated with linear rates of increase in the