
Page 253 - Geochemical Anomaly and Mineral Prospectivity Mapping in GIS
P. 253
256 Chapter 8
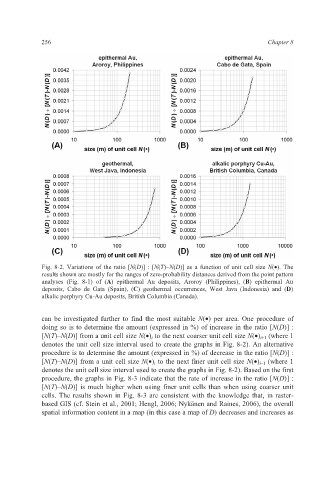
Fig. 8-2. Variations of the ratio [N(D)] : [N(T)–N(D)] as a function of unit cell size N(•). The
results shown are mostly for the ranges of zero-probability distances derived from the point pattern
analyses (Fig. 8-1) of (A) epithermal Au deposits, Aroroy (Philippines), (B) epithermal Au
deposits, Cabo de Gata (Spain), (C) geothermal occurrences, West Java (Indonesia) and (D)
alkalic porphyry Cu-Au deposits, British Columbia (Canada).
can be investigated further to find the most suitable N(•) per area. One procedure of
doing so is to determine the amount (expressed in %) of increase in the ratio [N(D)] :
[N(T)–N(D)] from a unit cell size N(•) i to the next coarser unit cell size N(•) i+1 (where 1
denotes the unit cell size interval used to create the graphs in Fig. 8-2). An alternative
procedure is to determine the amount (expressed in %) of decrease in the ratio [N(D)] :
[N(T)–N(D)] from a unit cell size N(•) i to the next finer unit cell size N(•) i–1 (where 1
denotes the unit cell size interval used to create the graphs in Fig. 8-2). Based on the first
procedure, the graphs in Fig. 8-3 indicate that the rate of increase in the ratio [N(D)] :
[N(T)–N(D)] is much higher when using finer unit cells than when using coarser unit
cells. The results shown in Fig. 8-3 are consistent with the knowledge that, in raster-
based GIS (cf. Stein et al., 2001; Hengl, 2006; Nykänen and Raines, 2006), the overall
spatial information content in a map (in this case a map of D) decreases and increases as