
Page 249 - Geochemical Anomaly and Mineral Prospectivity Mapping in GIS
P. 249
252 Chapter 8
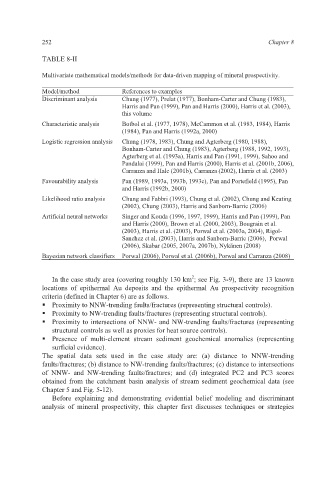
TABLE 8-II
Multivariate mathematical models/methods for data-driven mapping of mineral prospectivity.
Model/method References to examples
Discriminant analysis Chung (1977), Prelat (1977), Bonham-Carter and Chung (1983),
Harris and Pan (1999), Pan and Harris (2000), Harris et al. (2003),
this volume
Characteristic analysis Botbol et al. (1977, 1978), McCammon et al. (1983, 1984), Harris
(1984), Pan and Harris (1992a, 2000)
Logistic regression analysis Chung (1978, 1983), Chung and Agterberg (1980, 1988),
Bonham-Carter and Chung (1983), Agterberg (1988, 1992, 1993),
Agterberg et al. (1993a), Harris and Pan (1991, 1999), Sahoo and
Pandalai (1999), Pan and Harris (2000), Harris et al. (2001b, 2006),
Carranza and Hale (2001b), Carranza (2002), Harris et al. (2003)
Favourability analysis Pan (1989, 1993a, 1993b, 1993c), Pan and Portefield (1995), Pan
and Harris (1992b, 2000)
Likelihood ratio analysis Chung and Fabbri (1993), Chung et al. (2002), Chung and Keating
(2002), Chung (2003), Harris and Sanborn-Barrie (2006)
Artificial neural networks Singer and Kouda (1996, 1997, 1999), Harris and Pan (1999), Pan
and Harris (2000), Brown et al. (2000, 2003), Bougrain et al.
(2003), Harris et al. (2003), Porwal et al. (2003a, 2004), Rigol-
Sanchez et al. (2003), Harris and Sanborn-Barrie (2006), Porwal
(2006), Skabar (2005, 2007a, 2007b), Nykänen (2008)
Bayesian network classifiers Porwal (2006), Porwal et al. (2006b), Porwal and Carranza (2008)
2
In the case study area (covering roughly 130 km ; see Fig. 3-9), there are 13 known
locations of epithermal Au deposits and the epithermal Au prospectivity recognition
criteria (defined in Chapter 6) are as follows.
Proximity to NNW-trending faults/fractures (representing structural controls).
Proximity to NW-trending faults/fractures (representing structural controls).
Proximity to intersections of NNW- and NW-trending faults/fractures (representing
structural controls as well as proxies for heat source controls).
Presence of multi-element stream sediment geochemical anomalies (representing
surficial evidence).
The spatial data sets used in the case study are: (a) distance to NNW-trending
faults/fractures; (b) distance to NW-trending faults/fractures; (c) distance to intersections
of NNW- and NW-trending faults/fractures; and (d) integrated PC2 and PC3 scores
obtained from the catchment basin analysis of stream sediment geochemical data (see
Chapter 5 and Fig. 5-12).
Before explaining and demonstrating evidential belief modeling and discriminant
analysis of mineral prospectivity, this chapter first discusses techniques or strategies