
Page 259 - Geochemical Anomaly and Mineral Prospectivity Mapping in GIS
P. 259
262 Chapter 8
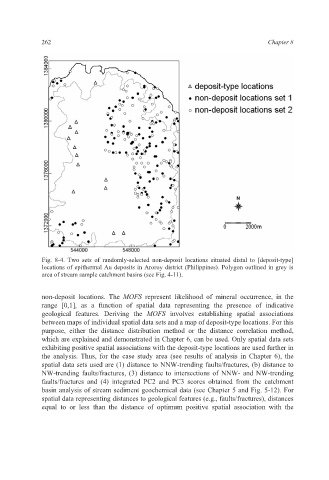
Fig. 8-4. Two sets of randomly-selected non-deposit locations situated distal to [deposit-type]
locations of epithermal Au deposits in Aroroy district (Philippines). Polygon outlined in grey is
area of stream sample catchment basins (see Fig. 4-11).
non-deposit locations. The MOFS represent likelihood of mineral occurrence, in the
range [0,1], as a function of spatial data representing the presence of indicative
geological features. Deriving the MOFS involves establishing spatial associations
between maps of individual spatial data sets and a map of deposit-type locations. For this
purpose, either the distance distribution method or the distance correlation method,
which are explained and demonstrated in Chapter 6, can be used. Only spatial data sets
exhibiting positive spatial associations with the deposit-type locations are used further in
the analysis. Thus, for the case study area (see results of analysis in Chapter 6), the
spatial data sets used are (1) distance to NNW-trending faults/fractures, (b) distance to
NW-trending faults/fractures, (3) distance to intersections of NNW- and NW-trending
faults/fractures and (4) integrated PC2 and PC3 scores obtained from the catchment
basin analysis of stream sediment geochemical data (see Chapter 5 and Fig. 5-12). For
spatial data representing distances to geological features (e.g., faults/fractures), distances
equal to or less than the distance of optimum positive spatial association with the