
Page 260 - Geochemical Anomaly and Mineral Prospectivity Mapping in GIS
P. 260
Data-Driven Modeling of Mineral Prospectivity 263
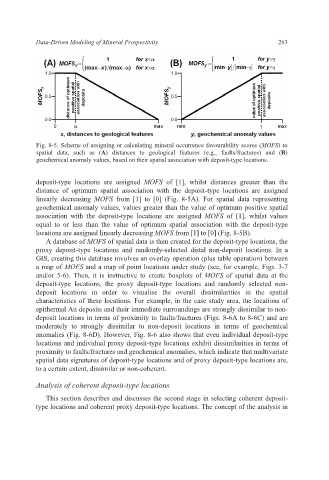
Fig. 8-5. Scheme of assigning or calculating mineral occurrence favourability scores (MOFS) to
spatial data, such as (A) distances to geological features (e.g., faults/fractures) and (B)
geochemical anomaly values, based on their spatial association with deposit-type locations.
deposit-type locations are assigned MOFS of [1], whilst distances greater than the
distance of optimum spatial association with the deposit-type locations are assigned
linearly decreasing MOFS from [1] to [0] (Fig. 8-5A). For spatial data representing
geochemical anomaly values, values greater than the value of optimum positive spatial
association with the deposit-type locations are assigned MOFS of [1], whilst values
equal to or less than the value of optimum spatial association with the deposit-type
locations are assigned linearly decreasing MOFS from [1] to [0] (Fig. 8-5B).
A database of MOFS of spatial data is then created for the deposit-type locations, the
proxy deposit-type locations and randomly-selected distal non-deposit locations. In a
GIS, creating this database involves an overlay operation (plus table operation) between
a map of MOFS and a map of point locations under study (see, for example, Figs. 3-7
and/or 5-6). Then, it is instructive to create boxplots of MOFS of spatial data at the
deposit-type locations, the proxy deposit-type locations and randomly selected non-
deposit locations in order to visualise the overall dissimilarities in the spatial
characteristics of these locations. For example, in the case study area, the locations of
epithermal Au deposits and their immediate surroundings are strongly dissimilar to non-
deposit locations in terms of proximity to faults/fractures (Figs. 8-6A to 8-6C) and are
moderately to strongly dissimilar to non-deposit locations in terms of geochemical
anomalies (Fig. 8-6D). However, Fig. 8-6 also shows that even individual deposit-type
locations and individual proxy deposit-type locations exhibit dissimilarities in terms of
proximity to faults/fractures and geochemical anomalies, which indicate that multivariate
spatial data signatures of deposit-type locations and of proxy deposit-type locations are,
to a certain extent, dissimilar or non-coherent.
Analysis of coherent deposit-type locations
This section describes and discusses the second stage in selecting coherent deposit-
type locations and coherent proxy deposit-type locations. The concept of the analysis in