
Page 263 - Geochemical Anomaly and Mineral Prospectivity Mapping in GIS
P. 263
266 Chapter 8
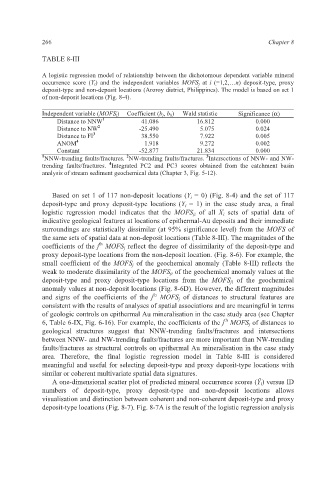
TABLE 8-III
A logistic regression model of relationship between the dichotomous dependent variable mineral
occurrence score (Y i ) and the independent variables MOFS j at i (=1,2,…n) deposit-type, proxy
deposit-type and non-deposit locations (Aroroy district, Philippines). The model is based on set 1
of non-deposit locations (Fig. 8-4).
Independent variable (MOFS j ) Coefficient (b j , b 0 ) Wald statistic Significance (α)
Distance to NNW 1 41.086 16.812 0.000
Distance to NW 2 -25.490 5.075 0.024
Distance to FI 3 38.550 7.922 0.005
ANOM 4 1.918 9.272 0.002
Constant -52.877 21.834 0.000
3
1 NNW-trending faults/fractures. NW-trending faults/fractures. Intersections of NNW- and NW-
2
4
trending faults/fractures. Integrated PC2 and PC3 scores obtained from the catchment basin
analysis of stream sediment geochemical data (Chapter 3, Fig. 5-12).
Based on set 1 of 117 non-deposit locations (Y i = 0) (Fig. 8-4) and the set of 117
deposit-type and proxy deposit-type locations (Y i = 1) in the case study area, a final
logistic regression model indicates that the MOFS ji of all X i sets of spatial data of
indicative geological features at locations of epithermal-Au deposits and their immediate
surroundings are statistically dissimilar (at 95% significance level) from the MOFS of
the same sets of spatial data at non-deposit locations (Table 8-III). The magnitudes of the
th
coefficients of the j MOFS j reflect the degree of dissimilarity of the deposit-type and
proxy deposit-type locations from the non-deposit location. (Fig. 8-6). For example, the
small coefficient of the MOFS j of the geochemical anomaly (Table 8-III) reflects the
weak to moderate dissimilarity of the MOFS ji of the geochemical anomaly values at the
deposit-type and proxy deposit-type locations from the MOFS ji of the geochemical
anomaly values at non-deposit locations (Fig. 8-6D). However, the different magnitudes
th
and signs of the coefficients of the j MOFS j of distances to structural features are
consistent with the results of analyses of spatial associations and are meaningful in terms
of geologic controls on epithermal Au mineralisation in the case study area (see Chapter
th
6, Table 6-IX, Fig. 6-16). For example, the coefficients of the j MOFS j of distances to
geological structures suggest that NNW-trending faults/fractures and intersections
between NNW- and NW-trending faults/fractures are more important than NW-trending
faults/fractures as structural controls on epithermal Au mineralisation in the case study
area. Therefore, the final logistic regression model in Table 8-III is considered
meaningful and useful for selecting deposit-type and proxy deposit-type locations with
similar or coherent multivariate spatial data signatures.
A one-dimensional scatter plot of predicted mineral occurrence scores (Ǔ i) versus ID
numbers of deposit-type, proxy deposit-type and non-deposit locations allows
visualisation and distinction between coherent and non-coherent deposit-type and proxy
deposit-type locations (Fig. 8-7). Fig. 8-7A is the result of the logistic regression analysis