
Page 267 - Geochemical Anomaly and Mineral Prospectivity Mapping in GIS
P. 267
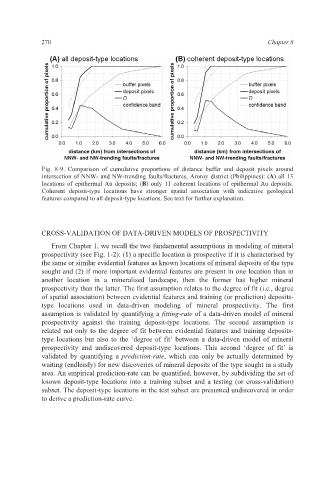
270                                                             Chapter 8


             Fig. 8-9. Comparison of cumulative proportions of distance buffer and deposit pixels around
             intersection of NNW- and NW-trending faults/fractures, Aroroy district (Philippines): (A) all 13
             locations of epithermal Au deposits; (B) only 11 coherent locations of epithermal Au deposits.
             Coherent deposit-type  locations have stronger spatial association with indicative geological
             features compared to all deposit-type locations. See text for further explanation.


             CROSS-VALIDATION OF DATA-DRIVEN MODELS OF PROSPECTIVITY

                From Chapter 1, we recall the two fundamental assumptions in modeling of mineral
             prospectivity (see Fig. 1-2): (1) a specific location is prospective if it is characterised by
             the same or similar evidential features as known locations of mineral deposits of the type
             sought and (2) if more important evidential features are present in one location than in
             another location in a mineralised landscape, then the former has higher mineral
             prospectivity than the latter. The first assumption relates to the degree of fit (i.e., degree
             of spatial association) between evidential features and training (or prediction) deposits-
             type locations used in data-driven modeling of mineral prospectivity. The first
             assumption is validated by quantifying a fitting-rate of a data-driven model of mineral
             prospectivity against the training  deposit-type locations. The second assumption is
             related not only to the degree of fit between evidential features and training deposits-
             type locations but also to the ‘degree  of fit’ between a data-driven model of mineral
             prospectivity and undiscovered  deposit-type locations. This second ‘degree of  fit’ is
             validated  by quantifying a prediction-rate, which can only be actually determined by
             waiting (endlessly) for new discoveries of mineral deposits of the type sought in a study
             area. An empirical prediction-rate can be quantified, however, by subdividing the set of
             known deposit-type locations into a training subset and a testing (or cross-validation)
             subset. The deposit-type locations in the test subset are presumed undiscovered in order
             to derive a prediction-rate curve.