
Page 264 - Geochemical Anomaly and Mineral Prospectivity Mapping in GIS
P. 264
Data-Driven Modeling of Mineral Prospectivity 267
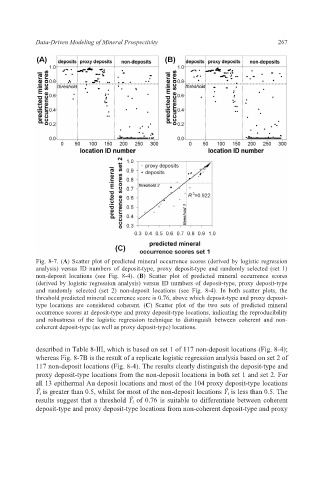
Fig. 8-7. (A) Scatter plot of predicted mineral occurrence scores (derived by logistic regression
analysis) versus ID numbers of deposit-type, proxy deposit-type and randomly selected (set 1)
non-deposit locations (see Fig. 8-4). (B) Scatter plot of predicted mineral occurrence scores
(derived by logistic regression analysis) versus ID numbers of deposit-type, proxy deposit-type
and randomly selected (set 2) non-deposit locations (see Fig. 8-4). In both scatter plots, the
threshold predicted mineral occurrence score is 0.76, above which deposit-type and proxy deposit-
type locations are considered coherent. (C) Scatter plot of the two sets of predicted mineral
occurrence scores at deposit-type and proxy deposit-type locations, indicating the reproducibility
and robustness of the logistic regression technique to distinguish between coherent and non-
coherent deposit-type (as well as proxy deposit-type) locations.
described in Table 8-III, which is based on set 1 of 117 non-deposit locations (Fig. 8-4);
whereas Fig. 8-7B is the result of a replicate logistic regression analysis based on set 2 of
117 non-deposit locations (Fig. 8-4). The results clearly distinguish the deposit-type and
proxy deposit-type locations from the non-deposit locations in both set 1 and set 2. For
all 13 epithermal Au deposit locations and most of the 104 proxy deposit-type locations
Ǔ i is greater than 0.5, whilst for most of the non-deposit locations Ǔ i is less than 0.5. The
results suggest that a threshold Ǔ i of 0.76 is suitable to differentiate between coherent
deposit-type and proxy deposit-type locations from non-coherent deposit-type and proxy