
Page 261 - Geochemical Anomaly and Mineral Prospectivity Mapping in GIS
P. 261
264 Chapter 8
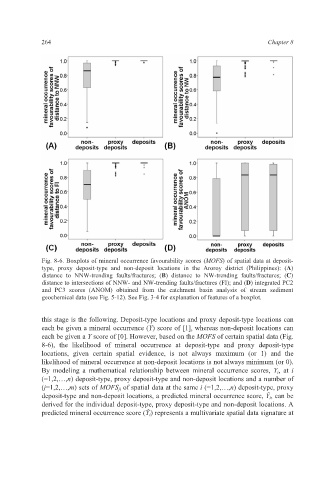
Fig. 8-6. Boxplots of mineral occurrence favourability scores (MOFS) of spatial data at deposit-
type, proxy deposit-type and non-deposit locations in the Aroroy district (Philippines): (A)
distance to NNW-trending faults/fractures; (B) distance to NW-trending faults/fractures; (C)
distance to intersections of NNW- and NW-trending faults/fractures (FI); and (D) integrated PC2
and PC3 scores (ANOM) obtained from the catchment basin analysis of stream sediment
geochemical data (see Fig. 5-12). See Fig. 3-4 for explanation of features of a boxplot.
this stage is the following. Deposit-type locations and proxy deposit-type locations can
each be given a mineral occurrence (Y) score of [1], whereas non-deposit locations can
each be given a Y score of [0]. However, based on the MOFS of certain spatial data (Fig.
8-6), the likelihood of mineral occurrence at deposit-type and proxy deposit-type
locations, given certain spatial evidence, is not always maximum (or 1) and the
likelihood of mineral occurrence at non-deposit locations is not always minimum (or 0).
By modeling a mathematical relationship between mineral occurrence scores, Y i, at i
(=1,2,…,n) deposit-type, proxy deposit-type and non-deposit locations and a number of
(j=1,2,…,m) sets of MOFS ji of spatial data at the same i (=1,2,…,n) deposit-type, proxy
deposit-type and non-deposit locations, a predicted mineral occurrence score, Ǔ i, can be
derived for the individual deposit-type, proxy deposit-type and non-deposit locations. A
predicted mineral occurrence score (Ǔ i) represents a multivariate spatial data signature at