
Page 134 - Geochemical Remote Sensing of The Sub-Surface
P. 134
Spontaneous potentials and electrochemical cells 111
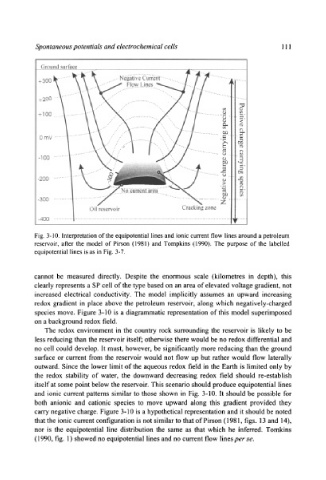
Fig. 3-10. Interpretation of the equipotential lines and ionic current flow lines around a petroleum
reservoir, after the model of Pirson (1981) and Tompkins (1990). The purpose of the labelled
equipotential lines is as in Fig. 3-7.
cannot be measured directly. Despite the enormous scale (kilometres in depth), this
clearly represents a SP cell of the type based on an area of elevated voltage gradient, not
increased electrical conductivity. The model implicitly assumes an upward increasing
redox gradient in place above the petroleum reservoir, along which negatively-charged
species move. Figure 3-10 is a diagrammatic representation of this model superimposed
on a background redox field.
The redox environment in the country rock surrounding the reservoir is likely to be
less reducing than the reservoir itself; otherwise there would be no redox differential and
no cell could develop. It must, however, be significantly more reducing than the ground
surface or current from the reservoir would not flow up but rather would flow laterally
outward. Since the lower limit of the aqueous redox field in the Earth is limited only by
the redox stability of water, the downward decreasing redox field should re-establish
itself at some point below the reservoir. This scenario should produce equipotential lines
and ionic current patterns similar to those shown in Fig. 3-10. It should be possible for
both anionic and cationic species to move upward along this gradient provided they
carry negative charge. Figure 3-10 is a hypothetical representation and it should be noted
that the ionic current configuration is not similar to that of Pirson (1981, figs. 13 and 14),
nor is the equipotential line distribution the same as that which he inferred. Tomkins
(1990, fig. 1) showed no equipotential lines and no current flow lines per se.