
Page 236 - Geochemical Remote Sensing of The Sub-Surface
P. 236
Light hydrocarbons for petroleum and gas prospecting 209
Overthrust Belt, Wyoming-Utah
The final example is one of the largest regional applications of light-gas surface
studies ever published (Dickinson and Matthews, 1993). Some 3300 km 2 (1280 square
miles) of the Wyoming-Utah overthrust belt, including the Clear Creek, Ryckman Creek
and Whitney Canyon-Carter Creek fields, plus several small fields, was investigated
using 1890 free soil-gas measurements (Fig. 5-43). The effective source rocks in the
area are believed to be within the subthnast Cretaceous (Warner 1982). The maturity of
these source rocks increases westward and appaears responsible for the change in
production from mixed oil, condensate and gas in the east, to dry gas, wet gas and some
condensate in the middle, to dry gas in the west.
The compositional information derived from the surface gas study falls within the
gas/condensate-mixed oil/gas classification of Jones and Drozd (1983). Further, there is
a trend towards a more gas prone character from east to west, in agreement with both the
production trends and increasing source rock maturity. A comparison of the light gas
analysis of produced hydrocarbons with the surface free gases shows that the (C2/C3)xl 0
values are in very good agreement for the Ryckman Creek and Clear Creek fields and in
general agreement with respect to the ranges of values for the multiple reservoirs in the
Whitney Canyon-Clear Creek field. The (C3/Cl)xl000 ratios, however, are considerably
more methane rich in the surface than in the subsurface at Ryckman Creek and Clear
Creek. This suggests that there is an independent source of methane in the region which
is mixing with the leakage of the Cretaceous-reservoired gases. This independent source
is either absent or much less effective at Whitney Canyon-Carter Creek.
In designing this study, Dickinson and Matthews (1993) decided that a sampling
density of two samples per 2.5 km 2 (1 square mile), with approximately uniform
distribution of locations, would represent a good compromise between the need for detail
and cost. The regional focus of this study precludes the identification of all but very
broad regions of interest because of the possibility of the occurrence of single point
anomalies due to the coarse sample spacing. As a result, Dickinson and Matthews
(1993) developed their cell technique, which we have previously described as an
anomaly-probability map. Figure 5-44 shows a composite cell map in which the
technique has been applied to methane, ethane and propane; the regions where all three
of these gases are above their respective medians has been highlighted. The average
number of sites within a cell was 18. Thus, binomial theory suggests that cells with
more than 75% of the values above the median would be expected to occur only 5% of
the time. The 75% contour line clearly identified several large areas that occupy more
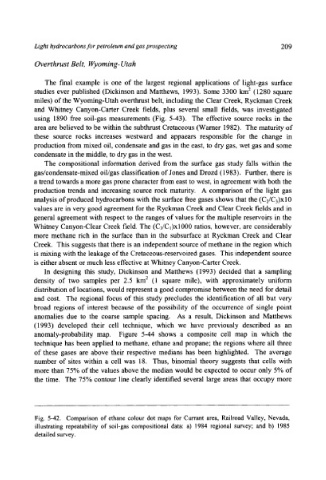
Fig. 5-42. Comparison of ethane colour dot maps for Currant area, Railroad Valley, Nevada,
illustrating repeatability of soil-gas compositional data: a) 1984 regional survey; and b) 1985
detailed survey.