
Page 269 - Geochemical Remote Sensing of The Sub-Surface
P. 269
242 H. Yang, F.D. Van der Meer and J. Zhang
50 - - Blue = 400-500 nm
Green = 500-600 nm
- Red = 600-700 nm
Infrared = 700-1100 nm
40
o-e
v 30 -- ,s S''~--! . . . . . . . . . .
CD
O
t---
"6 II I
CD
20
rv' (Lp) Blue shift
10
Ro
i i I ~J 1
0
400 500 600 i 700 800 900 1000 1100
- -
Wavelength (rim)
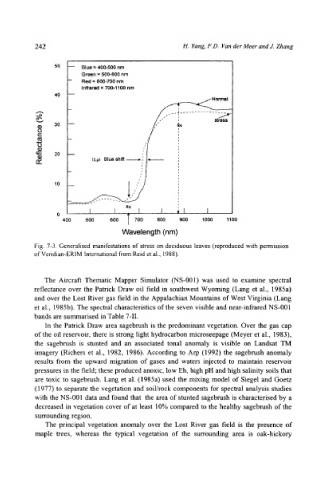
Fig. 7-3. Generalised manifestations of stress on deciduous leaves (reproduced with permission
of Veridian-ERIM International from Reid et al., 1988).
The Aircraft Thematic Mapper Simulator (NS-001) was used to examine spectral
reflectance over the Patrick Draw oil field in southwest Wyoming (Lang et al., 1985a)
and over the Lost River gas field in the Appalachian Mountains of West Virginia (Lang
et al., 1985b). The spectral characteristics of the seven visible and near-infrared NS-001
bands are summarised in Table 7-11.
In the Patrick Draw area sagebrush is the predominant vegetation. Over the gas cap
of the oil reservoir, there is strong light hydrocarbon microseepage (Meyer et al., 1983),
the sagebrush is stunted and an associated tonal anomaly is visible on Landsat TM
imagery (Richers et al., 1982, 1986). According to Arp (1992) the sagebrush anomaly
results from the upward migration of gases and waters injected to maintain reservoir
pressures in the field; these produced anoxic, low Eh, high pH and high salinity soils that
are toxic to sagebrush. Lang et al. (1985a) used the mixing model of Siegel and Goetz
(1977) to separate the vegetation and soil/rock components for spectral analysis studies
with the NS-001 data and found that the area of stunted sagebrush is characterised by a
decreased in vegetation cover of at least 10% compared to the healthy sagebrush of the
surrounding region.
The principal vegetation anomaly over the Lost River gas field is the presence of
maple trees, whereas the typical vegetation of the surrounding area is oak-hickory