
Page 98 - Geochemistry of Oil Field Waters
P. 98
86 ANALYSIS OF OILFIELD WATERS
8; B, I, 4995.46 8; Fe, 11, 5198.80 8; Mn, 11, 5152.20 8; Sr, 11,4215.52 8;
La, 11, 4086.62 8; and La, 11, 4429.90 8.
The background and intensity of the following lines can be read if some of
those above are too intense or if more than one line for a given element is
wanted: Ba, 11, 4934.09 8; B, I, 4993.56 8; Fe, 11, 4196.74 8; Mn, 11,
5187.46 8; La, 11, 4077.35 8; La, 11, 4123.23 8; Sr, 11, 4077.71 8; and Sr,
I, 4607.33 8.
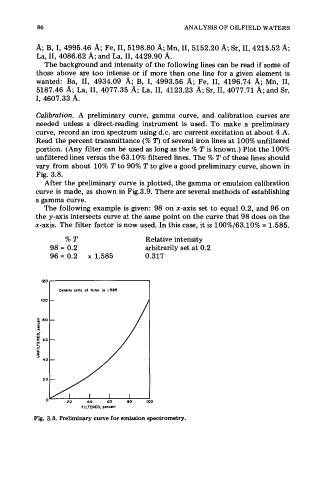
Calibration. A preliminary curve, gamma curve, and calibration curves are
needed unless a direct-reading instrument is used. To make a preliminary
curve, record an iron spectrum using d.c. arc current excitation at about 4 A.
Read the percent transmittance (% 2') of several iron lines at 100% unfiltered
portion. (Any filter can be used as long as the 5% T is known.) Plot the 100%
unfiltered lines versus the 63.10% filtered lines. The % T of these lines should
vary from about 10% T to 90% T to give a good preliminary curve, shown in
Fig. 3.8.
After the preliminary curve is plotted, the gamma or emulsion calibration
curve is made, as shown in Fig.3.9. There are several methods of establishing
a gamma curve.
The following example is given: 98 on x-axis set to equal 0.2, and 96 on
the y-axis intersects curve at the same point on the curve that 98 does on the
x-axis. The filter factor is now used. In this case, it is 100%/63.10% = 1.585.
%?' Relative intensity
98 = 0.2 arbitrarily set at 0.2
96 = 0.2 x 1.585 0.317
Owwit). rotio of filter is 1.585
100
0
FILTERED, percent
Fig. 3.8. Preliminary curve for emission spectrometry.