
Page 100 - Geothermal Energy Renewable Energy and The Environment
P. 100
Chemistry of Geothermal Fluids 85
last 10 years, the ability to undertake such modeling efforts has rapidly evolved. A number of
computer codes currently exist that are useful for modeling coupled hydrological, geochemical,
and physical processes (Glassley et al. 2001, 2003; Kühn and Gessner 2006; Steefel, DePaolo, and
Lichtner 2005; Xu and Preuss 2001). These “reactive transport” simulators, to varying degrees,
rigorously represent the complex chemical interactions as well as the hydrology of the flowing
systems in complex thermal regimes that possess, in three dimensions, varying hydrological and
mineralogical properties.
case sTUdy: The sIlIca sysTem
The mineral quartz is ubiquitous in geological systems. The properties of this system provide an
example of the range of issues, and their complexity that must be borne in mind when working with
geological systems that makeup geothermal sites.
The chemical composition of the silica system is SiO . The SiO , however, occurs in several differ-
2
2
ent forms or polymorphs. The minerals α-cristobalite, β-cristobalite, α-quartz, β-quartz, and tridym-
ite are some of the mineral forms that can occur in geothermal systems. The differences between
them are in how the individual atoms that form the crystal lattice for each mineral are arranged. Opal,
a form of α-cristobalite that contains water in microscopic pores, is also relatively common. As well,
amorphous silica, which is a form of SiO that is glass-like with no crystalline structure on the scale
2
of microns or larger, can also occur in a variety of settings where rapid precipitation occurs.
Each polymorph has specific conditions within which it is stable. Under dry conditions, α-quartz
is stable from surface conditions to 573°C, at which temperature it transforms to β-quartz. Above
867°C tridymite is the stable polymorph of SiO . In the presence of water or water vapor, SiO can
2
2
form as α-cristobalite up to about 220°C, beyond which β-cristobalite forms. This transformation
is reversible in the presence of water vapor (Meike and Glassley 1990).
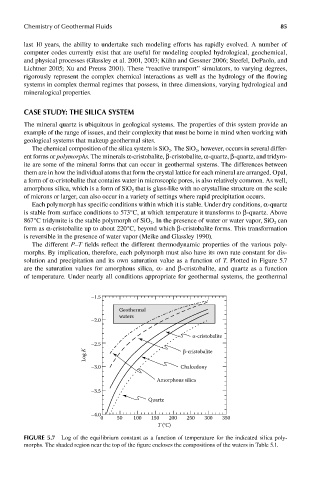
The different P–T fields reflect the different thermodynamic properties of the various poly-
morphs. By implication, therefore, each polymorph must also have its own rate constant for dis-
solution and precipitation and its own saturation value as a function of T. Plotted in Figure 5.7
are the saturation values for amorphous silica, α- and β-cristobalite, and quartz as a function
of temperature. Under nearly all conditions appropriate for geothermal systems, the geothermal
–1.5
Geothermal
waters
–2.0
α-cristobalite
–2.5
Log K β-cristobalite
–3.0 Chalcedony
Amorphous silica
–3.5
Quartz
–4.0
0 50 100 150 200 250 300 350
T (°C)
FIGUre 5.7 Log of the equilibrium constant as a function of temperature for the indicated silica poly-
morphs. The shaded region near the top of the figure encloses the compositions of the waters in Table 5.1.