
Page 188 - Geothermal Energy Renewable Energy and The Environment
P. 188
174 Geothermal Energy: Renewable Energy and the Environment
(a) Condensate
Condensate and SEGEP
steam run-off injection begins
120 60
100 50
80 40
10 9 kg 60 Yearly steam 30 10 3 kg/hr
production
40 20
Average yearly
20 well production 10
0 0
1970 1980 1990 2000 2010
Santa Rosa
(b) 400 waste water
Actual
Average annual generated power (MW) 300 Projected generated generated power
power
200
1997 1999 2001 2003 2005 2007
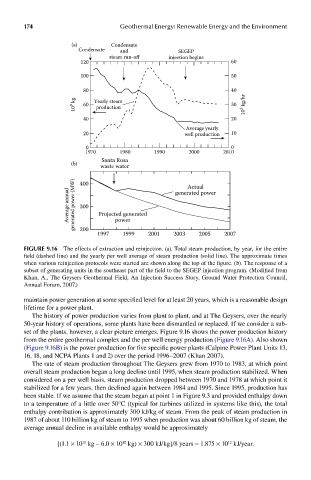
FIGUre 9.16 The effects of extraction and reinjection. (a). Total steam production, by year, for the entire
field (dashed line) and the yearly per well average of steam production (solid line). The approximate times
when various reinjection protocols were started are shown along the top of the figure. (b). The response of a
subset of generating units in the southeast part of the field to the SEGEP injection program. (Modified from
Khan, A., The Geysers Geothermal Field, An Injection Success Story, Ground Water Protection Council,
Annual Forum, 2007.)
maintain power generation at some specified level for at least 20 years, which is a reasonable design
lifetime for a power plant.
The history of power production varies from plant to plant, and at The Geysers, over the nearly
50-year history of operations, some plants have been dismantled or replaced. If we consider a sub-
set of the plants, however, a clear picture emerges. Figure 9.16 shows the power production history
from the entire geothermal complex and the per well energy production (Figure 9.16A). Also shown
(Figure 9.16B) is the power production for five specific power plants (Calpine Power Plant Units 13,
16, 18, and NCPA Plants 1 and 2) over the period 1996–2007 (Khan 2007).
The rate of steam production throughout The Geysers grew from 1970 to 1983, at which point
overall steam production began a long decline until 1995, when steam production stabilized. When
considered on a per well basis, steam production dropped between 1970 and 1978 at which point it
stabilized for a few years, then declined again between 1984 and 1995. Since 1995, production has
been stable. If we assume that the steam began at point 1 in Figure 9.3 and provided enthalpy down
to a temperature of a little over 50°C (typical for turbines utilized in systems like this), the total
enthalpy contribution is approximately 300 kJ/kg of steam. From the peak of steam production in
1987 of about 110 billion kg of steam to 1995 when production was about 60 billion kg of steam, the
average annual decline in available enthalpy would be approximately
{(1.1 × 10 kg – 6.0 × 10 kg) × 300 kJ/kg}/8 years = 1.875 × 10 kJ/year.
12
11
10