
Page 238 - Geothermal Energy Renewable Energy and The Environment
P. 238
Use of Geothermal Resources: Environmental Considerations 227
kg of CO /yr
2
10 6 10 7 10 8 10 9 10 10 10 11
Popocateptl, Mexico
White Island, New Zealand
Coal-fueled power plant
Mt. Erebus, Antarctica
Pantallera Island, Italy
Ustica Island, Italy
Natural gas-fueled power plant
Long Valley Caldera, California
Vulcano, Italy
Oil-fueled power plant
Solfatara, Italy
New Zealand geothermal sites
Azores
Geothermal flash plant
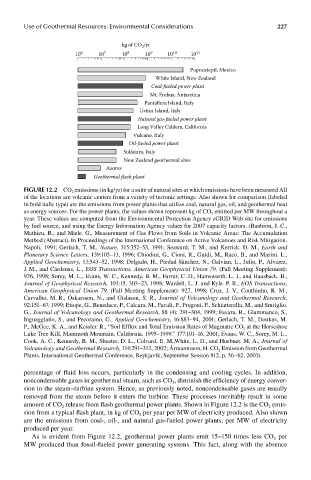
FIGUre 12.2 CO 2 emissions (in kg/yr) for a suite of natural sites at which emissions have been measured All
of the locations are volcanic centers from a variety of tectonic settings. Also shown for comparison (labeled
in bold italic type) are the emissions from power plants that utilize coal, natural gas, oil, and geothermal heat
as energy sources. For the power plants, the values shown represent kg of CO 2 emitted per MW throughout a
year. These values are computed from the Environmental Protection Agency eGRID Web site for emissions
by fuel source, and using the Energy Information Agency values for 2007 capacity factors. (Baubron, J.-C.,
Mathieu, R., and Miele. G., Measurement of Gas Flows from Soils in Volcanic Areas: The Accumulation
Method (Abstract). In Proceedings of the International Conference on Active Volcanoes and Risk Mitigation,
Napoli, 1991; Gerlach, T. M., Nature, 315:352–53, 1991; Seaward, T. M., and Kerrick. D. M., Earth and
Planetary Science Letters, 139:105–13, 1996; Chiodini, G., Cioni, R., Guidi, M., Raco, B., and Marini. L.,
Applied Geochemistry, 13:543–52, 1998; Delgado, H., Piedad-Sànchez, N., Galvian, L., Julio, P., Alvarez,
J. M., and Càrdenas, L., EOS Transactions, American Geophysical Union 79, (Fall Meeting Supplement):
926, 1998; Sorey, M. L., Evans, W. C., Kennedy, B. M., Farrar, C .D., Hainsworth, L. J., and Hausback. B.,
Journal of Geophysical Research, 103:15, 303–23, 1998; Wardell, L. J. and Kyle. P. R., EOS Transactions,
American Geophysical Union 79, (Fall Meeting Supplement): 927, 1998; Cruz, J. V., Couthinho, R. M.,
Carvalho, M. R., Óskarsson, N., and Gíslason, S. R., Journal of Volcanology and Geothermal Research,
92:151–67, 1999; Etiope, G., Beneduce, P., Calcara, M., Favali, P., Frugoni, F., Schiatterella, M., and Smriglio.
G., Journal of Volcanology and Geothermal Research, 88 (4): 291–304, 1999; Favara, R., Giammanco, S.,
Inguaggiatio, S., and Pecoraino, G., Applied Geochemistry, 16:883–94, 2001; Gerlach, T. M., Doukas, M.
P., McGee, K. A., and Kessler. R., “Soil Efflux and Total Emission Rates of Magmatic CO 2 at the Horseshoe
Lake Tree Kill, Mammoth Mountain, California, 1995–1999.” 177:101–16, 2001; Evans, W. C., Sorey, M. L.,
Cook, A. C., Kennedy, B. M., Shuster, D. L., Colvard, E. M.,White, L. D., and Huebner. M. A., Journal of
Volcanology and Geothermal Research, 114:291–312, 2002; Ármannsson, H. CO 2 Emission from Geothermal
Plants. International Geothermal Conference, Reykjavík, September Session #12, p. 56–62, 2003).
percentage of fluid loss occurs, particularly in the condensing and cooling cycles. In addition,
noncondensable gases in geothermal steam, such as CO , diminish the efficiency of energy conver-
2
sion in the steam–turbine system. Hence, as previously noted, noncondensable gases are usually
removed from the steam before it enters the turbine. These processes inevitably result in some
amount of CO release from flash geothermal power plants. Shown in Figure 12.2 is the CO emis-
2
2
sion from a typical flash plant, in kg of CO per year per MW of electricity produced. Also shown
2
are the emissions from coal-, oil-, and natural gas-fueled power plants, per MW of electricity
produced per year.
As is evident from Figure 12.2, geothermal power plants emit 15–150 times less CO per
2
MW produced than fossil-fueled power generating systems. This fact, along with the absence