Page 296 - Geothermal Energy Systems Exploration, Development, and Utilization
P. 296

272  5 Geothermal Reservoir Simulation
                                  440


                                  420


                                  400
                                 Temperature (K)  380


                                  360
                                                                   Single stimulation: linear
                                                                   Single stimulation: quadratic
                                  340                              Double stimulation: linear
                                                                   Double stimulation: quadratic

                                  320
                                     0           100          200         300          400
                               (a)                  Distance from injection well (m)

                                  440

                                  420


                                  400
                                 Temperature (K)  380              Single stimulation: linear


                                                                   Single stimulation: quadratic
                                  360                              Double stimulation: linear
                                                                   Double stimulation: quadratic
                                  340


                                  320
                                     0                5                10               15
                               (b)                        Time (y)

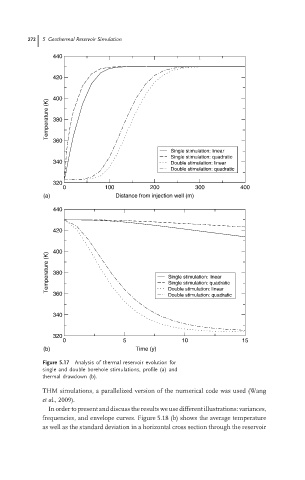
                               Figure 5.17  Analysis of thermal reservoir evolution for
                               single and double borehole stimulations, profile (a) and
                               thermal drawdown (b).

                               THM simulations, a parallelized version of the numerical code was used (Wang
                               et al., 2009).
                                 In order to present and discuss the results we use different illustrations: variances,
                               frequencies, and envelope curves. Figure 5.18 (b) shows the average temperature
                               as well as the standard deviation in a horizontal cross section through the reservoir
   291   292   293   294   295   296   297   298   299   300   301