
Page 297 - Geothermal Energy Systems Exploration, Development, and Utilization
P. 297
5.6 Bad Urach 273
150
430
100
Y
410
50 390
430
350
370 430
U3 330
370
0
−400 −300 −200 −100 0 100
(a) X
150
1.0
100
Y
3.0
50
3.0
5.0
U3
5.0 7.0
0
−400 −300 −200 −100 0 100
(b) X
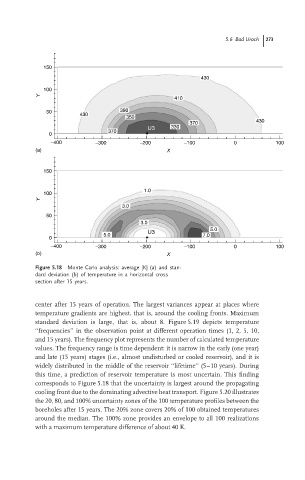
Figure 5.18 Monte Carlo analysis: average [K] (a) and stan-
dard deviation (b) of temperature in a horizontal cross
section after 15 years.
center after 15 years of operation. The largest variances appear at places where
temperature gradients are highest, that is, around the cooling fronts. Maximum
standard deviation is large, that is, about 8. Figure 5.19 depicts temperature
‘‘frequencies’’ in the observation point at different operation times (1, 2, 5, 10,
and 15 years). The frequency plot represents the number of calculated temperature
values. The frequency range is time dependent: it is narrow in the early (one year)
and late (15 years) stages (i.e., almost undisturbed or cooled reservoir), and it is
widely distributed in the middle of the reservoir ‘‘lifetime’’ (5–10 years). During
this time, a prediction of reservoir temperature is most uncertain. This finding
corresponds to Figure 5.18 that the uncertainty is largest around the propagating
cooling front due to the dominating advective heat transport. Figure 5.20 illustrates
the 20, 80, and 100% uncertainty zones of the 100 temperature profiles between the
boreholes after 15 years. The 20% zone covers 20% of 100 obtained temperatures
around the median. The 100% zone provides an envelope to all 100 realizations
with a maximum temperature difference of about 40 K.