Page 298 - Geothermal Energy Systems Exploration, Development, and Utilization
P. 298

274  5 Geothermal Reservoir Simulation

                                  30

                                                                           1 year
                                                                           2 years
                                                                           5 years
                                                                           10 years
                                                                           15 years
                                  20
                                 Frequency (%)


                                  10


                                   0
                                    320      340     360      380      400     420      440
                                                         Temperature (K)
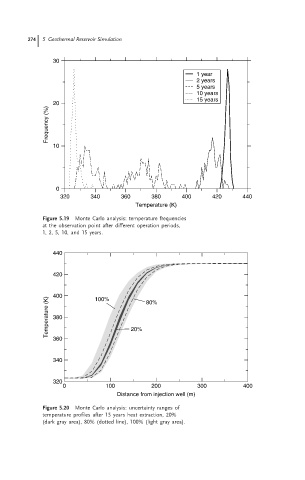
                               Figure 5.19  Monte Carlo analysis: temperature frequencies
                               at the observation point after different operation periods,
                               1, 2, 5, 10, and 15 years.

                                  440


                                  420


                                  400         100%          80%
                                 Temperature (K)  380


                                  360                   20%

                                  340


                                  320
                                     0           100          200          300          400
                                                    Distance from injection well (m)

                               Figure 5.20  Monte Carlo analysis: uncertainty ranges of
                               temperature profiles after 15 years heat extraction, 20%
                               (dark gray area), 80% (dotted line), 100% (light gray area).
   293   294   295   296   297   298   299   300   301   302   303