
Page 43 - Geothermal Energy Systems Exploration, Development, and Utilization
P. 43
1.2 Heat Flow and Deep Temperatures in Europe 19
Conductivity
(w/m/K)
< 1.3
1.3 - 1.8
1.8 - 2.3
2.3 - 2.8
2.8 - 3.3
> 3.3
(a)
Gradient (°C/km)
< 10
10 - 20
20 - 30
30 - 40
40 - 50
> 50
(b)
Data quality
1 (good)
2 (medium)
3 (low)
Heat_Flow
< 40
40 - 55
55 - 70
70 - 85
85 - 100
> 100
(c)
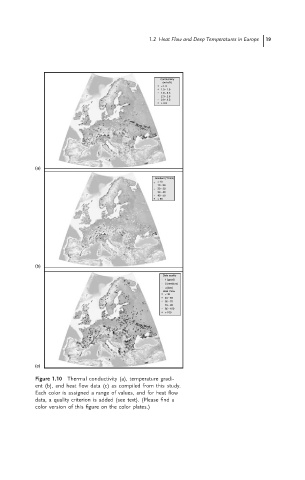
Figure 1.10 Thermal conductivity (a), temperature gradi-
ent (b), and heat flow data (c) as compiled from this study.
Each color is assigned a range of values, and for heat flow
data, a quality criterion is added (see text). (Please find a
color version of this figure on the color plates.)