Page 40 - Geothermal Energy Systems Exploration, Development, and Utilization
P. 40

16  1 Reservoir Definition

                                                                        SDT - Moho+20 km
                                                             60°N
                             P


                        50°
                                                             50°N


                                                             40°N
                        40°

                                                             30°N
                                                               20°W         0°         20°E
                                                 Depth 100 km       −9.0−5.4−4.5−3.6−2.7−1.8−0.9 0.0 0.7 1.4 2.1 2.8 3.5 4.2 7.0
                            S
                                                                         SRT - Moho+20 km
                                                             60°N

                        50°

                                                             50°N

                        40°
                                                             40°N


                                                             30°N
                          350°     0°      10°     20°         20°W          0°        20°E
                                                                    −9.0−5.4−4.5−3.6−2.7−1.8−0.9 0.0 0.7 1.4 2.1 2.8 3.5 4.2 7.0
                                  0    500  1000  1500
                                     Temperature (°C)
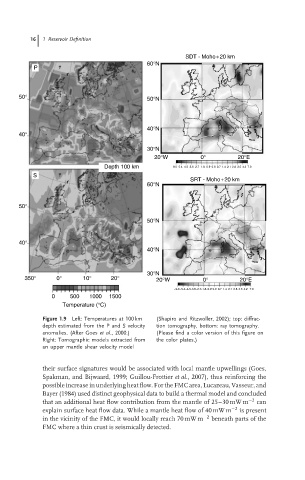
                               Figure 1.9  Left: Temperatures at 100 km  (Shapiro and Ritzwoller, 2002); top: diffrac-
                               depth estimated from the P and S velocity  tion tomography, bottom: ray tomography.
                               anomalies. (After Goes et al., 2000.)  (Please find a color version of this figure on
                               Right: Tomographic models extracted from  the color plates.)
                               an upper mantle shear velocity model


                               their surface signatures would be associated with local mantle upwellings (Goes,
                               Spakman, and Bijwaard, 1999; Guillou-Frottier et al., 2007), thus reinforcing the
                               possible increase in underlying heat flow. For the FMC area, Lucazeau, Vasseur, and
                               Bayer (1984) used distinct geophysical data to build a thermal model and concluded
                               that an additional heat flow contribution from the mantle of 25–30 mW m −2  can
                               explain surface heat flow data. While a mantle heat flow of 40 mW m −2  is present
                               in the vicinity of the FMC, it would locally reach 70 mW m −2  beneath parts of the
                               FMC where a thin crust is seismically detected.
   35   36   37   38   39   40   41   42   43   44   45