
Page 44 - Geothermal Energy Systems Exploration, Development, and Utilization
P. 44
20 1 Reservoir Definition
-60 °C
60-80 °C
60-100° C
100-120° C
120-140° C
140-160° C
160-180° C
180-200° C
200-240° C
-240° C
Color code
confirmed
Color code
corrected or
inferred
Color code
partly confirmed
Color code
not confirmed or
zone of low interest
Zone investigated
with asociated
color code
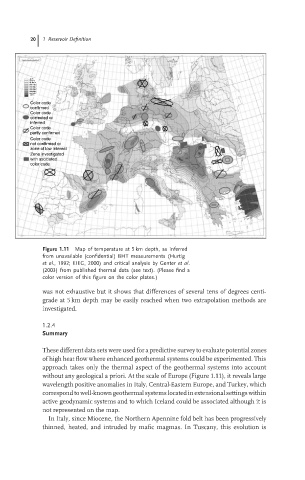
Figure 1.11 Map of temperature at 5 km depth, as inferred
from unavailable (confidential) BHT measurements (Hurtig
et al., 1992; EIEG, 2000) and critical analysis by Genter et al.
(2003) from published thermal data (see text). (Please find a
color version of this figure on the color plates.)
was not exhaustive but it shows that differences of several tens of degrees centi-
grade at 5 km depth may be easily reached when two extrapolation methods are
investigated.
1.2.4
Summary
These different data sets were used for a predictive survey to evaluate potential zones
of high heat flow where enhanced geothermal systems could be experimented. This
approach takes only the thermal aspect of the geothermal systems into account
without any geological a priori. At the scale of Europe (Figure 1.11), it reveals large
wavelength positive anomalies in Italy, Central-Eastern Europe, and Turkey, which
correspond to well-knowngeothermalsystems located inextensionalsettings within
active geodynamic systems and to which Iceland could be associated although it is
not represented on the map.
In Italy, since Miocene, the Northern Apennine fold belt has been progressively
thinned, heated, and intruded by mafic magmas. In Tuscany, this evolution is