
Page 73 - Geothermal Energy Systems Exploration, Development, and Utilization
P. 73
2.3 Relevance of the Stress Field for EGS 49
0
330 30
300 60 ∆ P
151.14
270 90
118.68
240 120
210 150
86.23
180
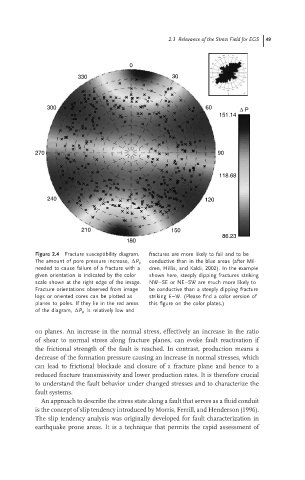
Figure 2.4 Fracture susceptibility diagram. fractures are more likely to fail and to be
The amount of pore pressure increase, P p conductive than in the blue areas (after Mil-
needed to cause failure of a fracture with a dren, Hillis, and Kaldi, 2002). In the example
given orientation is indicated by the color shown here, steeply dipping fractures striking
scaleshown at theright edgeof theimage. NW–SE or NE–SW are much more likely to
Fracture orientations observed from image be conductive than a steeply dipping fracture
logs or oriented cores can be plotted as striking E–W. (Please find a color version of
planes to poles. If they lie in the red areas this figure on the color plates.)
of the diagram, P p is relatively low and
on planes. An increase in the normal stress, effectively an increase in the ratio
of shear to normal stress along fracture planes, can evoke fault reactivation if
the frictional strength of the fault is reached. In contrast, production means a
decrease of the formation pressure causing an increase in normal stresses, which
can lead to frictional blockade and closure of a fracture plane and hence to a
reduced fracture transmissivity and lower production rates. It is therefore crucial
to understand the fault behavior under changed stresses and to characterize the
fault systems.
An approach to describe the stress state along a fault that serves as a fluid conduit
is the concept of slip tendency introduced by Morris, Ferrill, and Henderson (1996).
The slip tendency analysis was originally developed for fault characterization in
earthquake prone areas. It is a technique that permits the rapid assessment of