
Page 388 - Global Project Management Handbook
P. 388
PROJECT PORTFOLIO SCORE CARD 19-3
Project Score Card
The project score card (described earlier in this book) represents a project information
system and serves as an aid for visualizing the current status of a project.
Project Portfolio Score Card
The project portfolio score card (PPSC) (as explained earlier in this book) is a control
tool for the project-oriented organization. The PPSC is the “control center” of a project-
oriented organization and provides for the operationalization of project-relevant strategic
goals. The PPSC therefore is an instrument in which the strategic success factors of a
project-oriented organization can be brought together and visualized.
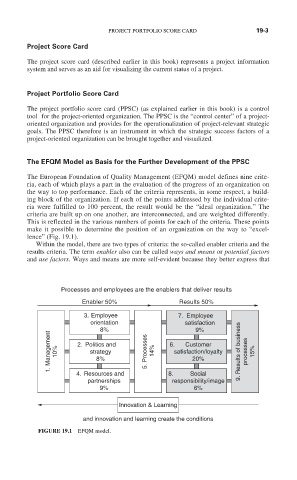
The EFQM Model as Basis for the Further Development of the PPSC
The European Foundation of Quality Management (EFQM) model defines nine crite-
ria, each of which plays a part in the evaluation of the progress of an organization on
the way to top performance. Each of the criteria represents, in some respect, a build-
ing block of the organization. If each of the points addressed by the individual crite-
ria were fulfilled to 100 percent, the result would be the “ideal organization.” The
criteria are built up on one another, are interconnected, and are weighted differently.
This is reflected in the various numbers of points for each of the criteria. These points
make it possible to determine the position of an organization on the way to “excel-
lence” (Fig. 19.1).
Within the model, there are two types of criteria: the so-called enabler criteria and the
results criteria. The term enabler also can be called ways and means or potential factors
and use factors. Ways and means are more self-evident because they better express that
Processes and employees are the enablers that deliver results
Enabler 50% Results 50%
3. Employee 7. Employee
orientation satisfaction
8% 9%
1. Management 10% 2. Politics and 5. Processes 14% 6. Customer 9. Results of business processes 15%
strategy
satisfaction/loyalty
8%
20%
4. Resources and 8. Social
partnerships responsibility/image
9% 6%
Innovation & Learning
and innovation and learning create the conditions
FIGURE 19.1 EFQM model.