
Page 189 - Global Tectonics
P. 189
CONTINENTAL RIFTS AND RIFTED MARGINS 175
Temperature ( C) trends in basalts is often diffi cult to achieve at the local
800 1000 1200 1400 1600 and regional scales. For example, attempts to document
0 a systematic decrease in the degree of lithospheric con-
tamination as rifting progresses have proven elusive.
Such a decrease might be expected if, as the lithosphere
1.0 30 thins and eventually ruptures, melts from the sublitho-
Dry solidus
spheric mantle begin to penetrate the surface without
Pressure (GPa) 2.0 Continent geotherm Gt Astheno- 60 Depth (km) However, studies in Kenya and Ethiopia show no sys-
Amphibole
significant interaction with lithosphere-derived melts.
Wet solidus
tematic temporal or spatial patterns in the degree of
Sp
lithospheric contamination in rift basalts (Macdonald
3.0 sphere 90 et al., 2001). This indicates that rift models involving the
progressive evolution of alkaline magmas toward more
Phlogopite
tholeiitic magmas during the transition to sea fl oor
Amph (OH 57 F 43 ) 120 spreading are too simplistic. Instead, the data suggest
Plume
4.0 Amph (F 100 ) that the full compositional range of mafi c melts can
coexist in continental rifts and that magma genesis may
involve multiple sources at any stage of the rifting
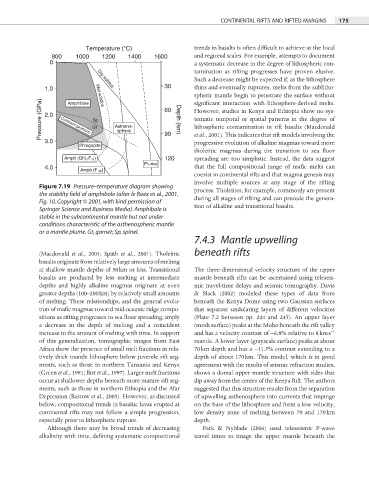
Figure 7.19 Pressure–temperature diagram showing
process. Tholeiites, for example, commonly are present
the stability field of amphibole (after le Roex et al., 2001,
during all stages of rifting and can precede the genera-
Fig. 10. Copyright © 2001, with kind permission of
tion of alkaline and transitional basalts.
Springer Science and Business Media). Amphibole is
stable in the subcontinental mantle but not under
conditions characteristic of the asthenospheric mantle
or a mantle plume. Gt, garnet; Sp, spinel.
7.4.3 Mantle upwelling
(Macdonald et al., 2001; Späth et al., 2001). Tholeiitic beneath rifts
basalts originate from relatively large amounts of melting
at shallow mantle depths of 50 km or less. Transitional The three-dimensional velocity structure of the upper
basalts are produced by less melting at intermediate mantle beneath rifts can be ascertained using teleseis-
depths and highly alkaline magmas originate at even mic travel-time delays and seismic tomography. Davis
greater depths (100–200 km) by relatively small amounts & Slack (2002) modeled these types of data from
of melting. These relationships, and the general evolu- beneath the Kenya Dome using two Gaussian surfaces
tion of mafic magmas toward mid-oceanic ridge compo- that separate undulating layers of different velocities
sitions as rifting progresses to sea floor spreading, imply (Plate 7.2 between pp. 244 and 245). An upper layer
a decrease in the depth of melting and a coincident (mesh surface) peaks at the Moho beneath the rift valley
−1
increase in the amount of melting with time. In support and has a velocity contrast of −6.8% relative to 8 km s
of this generalization, tomographic images from East mantle. A lower layer (grayscale surface) peaks at about
Africa show the presence of small melt fractions in rela- 70 km depth and has a −11.5% contrast extending to a
tively thick mantle lithosphere below juvenile rift seg- depth of about 170 km. This model, which is in good
ments, such as those in northern Tanzania and Kenya agreement with the results of seismic refraction studies,
(Green et al., 1991; Birt et al., 1997). Larger melt fractions shows a domal upper mantle structure with sides that
occur at shallower depths beneath more mature rift seg- dip away from the center of the Kenya Rift. The authors
ments, such as those in northern Ethiopia and the Afar suggested that this structure results from the separation
Depression (Bastow et al., 2005). However, as discussed of upwelling asthenosphere into currents that impinge
below, compositional trends in basaltic lavas erupted at on the base of the lithosphere and form a low velocity,
continental rifts may not follow a simple progression, low density zone of melting between 70 and 170 km
especially prior to lithospheric rupture. depth.
Although there may be broad trends of decreasing Park & Nyblade (2006) used teleseismic P-wave
alkalinity with time, defining systematic compositional travel times to image the upper mantle beneath the