
Page 194 - Global Tectonics
P. 194
(a)
Differential stress
200 400 (MPa)
0 T 0 C
Upper crust
20
Lower crust (diabase)
40
Mantle lithosphere (olivine)
60
80
100
120
(km) T 1333 C
(b) Temperature (2 Myr) (c) Temperature (10 Myr) (d) Temperature (20 Myr)
T( C) T( C) T( C)
0 0 0
1250 1250 1250
20
1000 20 1000 20 1000
40 750 40 750 750
Depth (km) 60 750 500 60 750 500 40 750 500
250
250
250
80
1000
80 1000 60
100 1000
80
120 100
0 500 1000 (km) 0 500 1000 (km) 0 500 1000 (km)
1
(e) Crustal thinning (β) (f) Mantle lithosphere thinning (δ) (g) Strength (N m )
25 25 25 2
1.5 3
5 15 1.8 8 10 12
20 20 20 4 7 10 12
10 1.4 1.4 12
5 1.3 1.2 6 10
3.5 2 15 1.3 1.2 15 5 5 10 12 12
15
Time (Ma ) 10 2.0 1.2 10 10 6 3 10 12 12
4 10
2 10
1.5
1.2 1.2 7 1 10 12
5 5
5
8
0 0 0
0 500 1000 (km) 0 500 1000 (km) 0 500 1000 (km)
(h) Temperature (30 Myr) (i) Temperature (50 Myr) (j) Temperature (70 Myr)
T( C) T( C) T( C)
0 0 0
1250 1250 1250
20 20 20
1000 1000 1000
Depth (km) 40 750 750 40 750 750 40 750 750
500
500
500
60
1000 250 60 250 60 1000 250
80 1000
80
100 80
0 500 1000 (km) 0 500 1000 (km) 0 500 1000 (km)
1
(k) Crustal thinning (β) (l) Mantle lithosphere thinning (δ) (m) Strength (N m )
100 1.7 100 1.7 1.7 100
1.85 7.2 10 12
1.6 1.6
1.85 1.80 1.6 6.8 10 12
80 1.75 80 80 4.8
1.7 1.5 1.5 6.4 10 12
1.3 1.6 60 1.4 60 5.2 5.6 6.0 10 12
Time (Ma) 40 1.4 40 1.7 1.4 40 5.6 10 12 12
1.5
60
1.3
5.2 10
1.3
1.2
1.1 1.2 4.6 4.8 10 12
20 20 20 4.4 10 12
1.1 1.1
0 0 0
0 500 1000 (km) 0 500 1000 (km) 0 500 1000 (km)
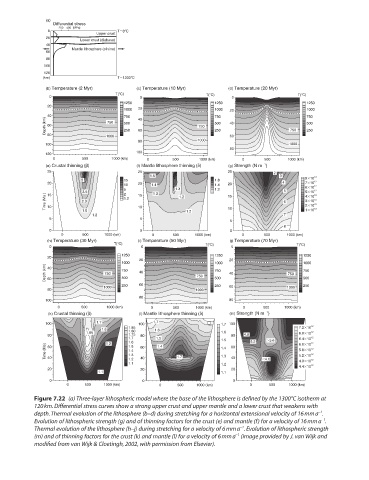
Figure 7.22 (a) Three-layer lithospheric model where the base of the lithosphere is defined by the 1300°C isotherm at
120 km. Differential stress curves show a strong upper crust and upper mantle and a lower crust that weakens with
−1
depth. Thermal evolution of the lithosphere (b–d) during stretching for a horizontal extensional velocity of 16 mm a .
−1
Evolution of lithospheric strength (g) and of thinning factors for the crust (e) and mantle (f) for a velocity of 16 mm a .
−1
Thermal evolution of the lithosphere (h–j) during stretching for a velocity of 6 mm a . Evolution of lithospheric strength
−1
(m) and of thinning factors for the crust (k) and mantle (l) for a velocity of 6 mm a (image provided by J. van Wijk and
modified from van Wijk & Cloetingh, 2002, with permission from Elsevier).