Page 196 - Global Tectonics
P. 196

182   CHAPTER 7


           (a) Narrow rift mode                                            Q s   60 mW m  2
                                                                       C       MPa      log (Pa-s)
                                                                  0      1200 0     600 17     23
                                                                 0
                Crust
                                                                20
                                                               Depth (km)  40
                Mantle


                                                                60
                                            Lithosphere
                                                                80
                                         Asthenosphere
                                                                   Temperature  Yield strength  Viscosity

           (b) Wide rift mode                                              Q s   80 mW m  2
                                                                       C       MPa      log (Pa-s)
                                                                  0      1200 0     600 17     23
                                                                 0


                Crust                                          Depth (km)  20
                Mantle
                                            Lithosphere         40

                                          Asthenosphere         60
                                                                   Temperature  Yield strength  Viscosity


           (c) Core complex mode                                           Q s  100 mW m  2
                                                                       C       MPa      log (Pa-s)
                                                                  0      1200 0     600 17     23
                upper crust                 Lithosphere          0
                                          Asthenosphere         20
                                                               Depth (km)

                lower crust                                     40


                                                                60
                                                                   Temperature  Yield strength  Viscosity
                     Straining
                     region     40 km           V.E.   2
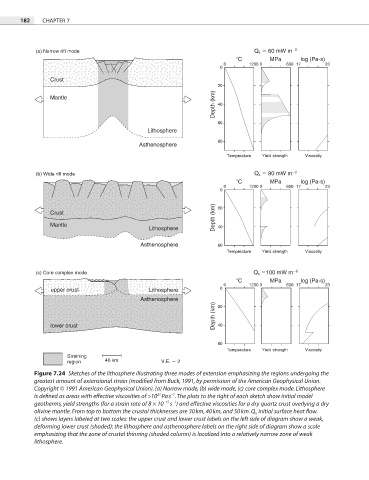
           Figure 7.24  Sketches of the lithosphere illustrating three modes of extension emphasizing the regions undergoing the

           greatest amount of extensional strain (modified from Buck, 1991, by permission of the American Geophysical Union.
           Copyright © 1991 American Geophysical Union). (a) Narrow mode, (b) wide mode, (c) core complex mode. Lithosphere
                                                   −1
                                               21
           is defined as areas with effective viscosities of >10  Pa s . The plots to the right of each sketch show initial model

                                                −15 −1
           geotherms, yield strengths (for a strain rate of 8 × 10  s ) and effective viscosities for a dry quartz crust overlying a dry
           olivine mantle. From top to bottom the crustal thicknesses are 30 km, 40 km, and 50 km. Q s,  initial surface heat fl ow.
           (c) shows layers labeled at two scales: the upper crust and lower crust labels on the left side of diagram show a weak,
           deforming lower crust (shaded); the lithosphere and asthenosphere labels on the right side of diagram show a scale
           emphasizing that the zone of crustal thinning (shaded column) is localized into a relatively narrow zone of weak
           lithosphere.
   191   192   193   194   195   196   197   198   199   200   201